December 6, 2018
Transit agencies have long used ridership models to project how many people would use new services and how much it would cost to run them. However, current models don’t capture the priorities of transit users – like how long they’ll have to wait, how often they’ll need to transfer, or how much time they will spend riding the bus.
Kittelson and Omnimodal, LLC worked with Orlando transit agency LYNX to address this gap. Their work landed the project team on the list of finalists for the Transportation Research Board (TRB)’s Innovations in Transit Performance Measurement Challenge, which will culminate at the 2019 Annual Meeting.
About the Challenge
TRB’s Annual Meeting takes place in January every year, gathering 13,000+ industry professionals to discuss key topics and identify research needs. As part of the 2019 meeting, TRB introduced the Innovations in Transit Performance Measurement Challenge, a contest aimed at advancing the use of data by transit agencies to inform decisions. They invited participants to share creative new approaches to analyzing data and communicating results. Participation in the challenge exceeded TRB’s expectations, leading to the selection of eight finalists to present at TRB 2019.
The Kittelson-Omnimodal entry is led by Kittelson’s Jorge Barrios and Omnimodal’s Nathan Selikoff and David Thomas Moran.
Considering Transit Users in an Innovative Data Model
In a recent study on one of its busiest corridors, LYNX considered a range of alternatives to increase the frequency and quality of transit service. Through the use of open-source data formats and software, Kittelson built a trip routing engine that simulated the impact of the proposed alternatives on a trip-by-trip basis. This workflow was unique in that it captured what’s important to users, including wait time, frequency of transfers, and time spent on the bus.
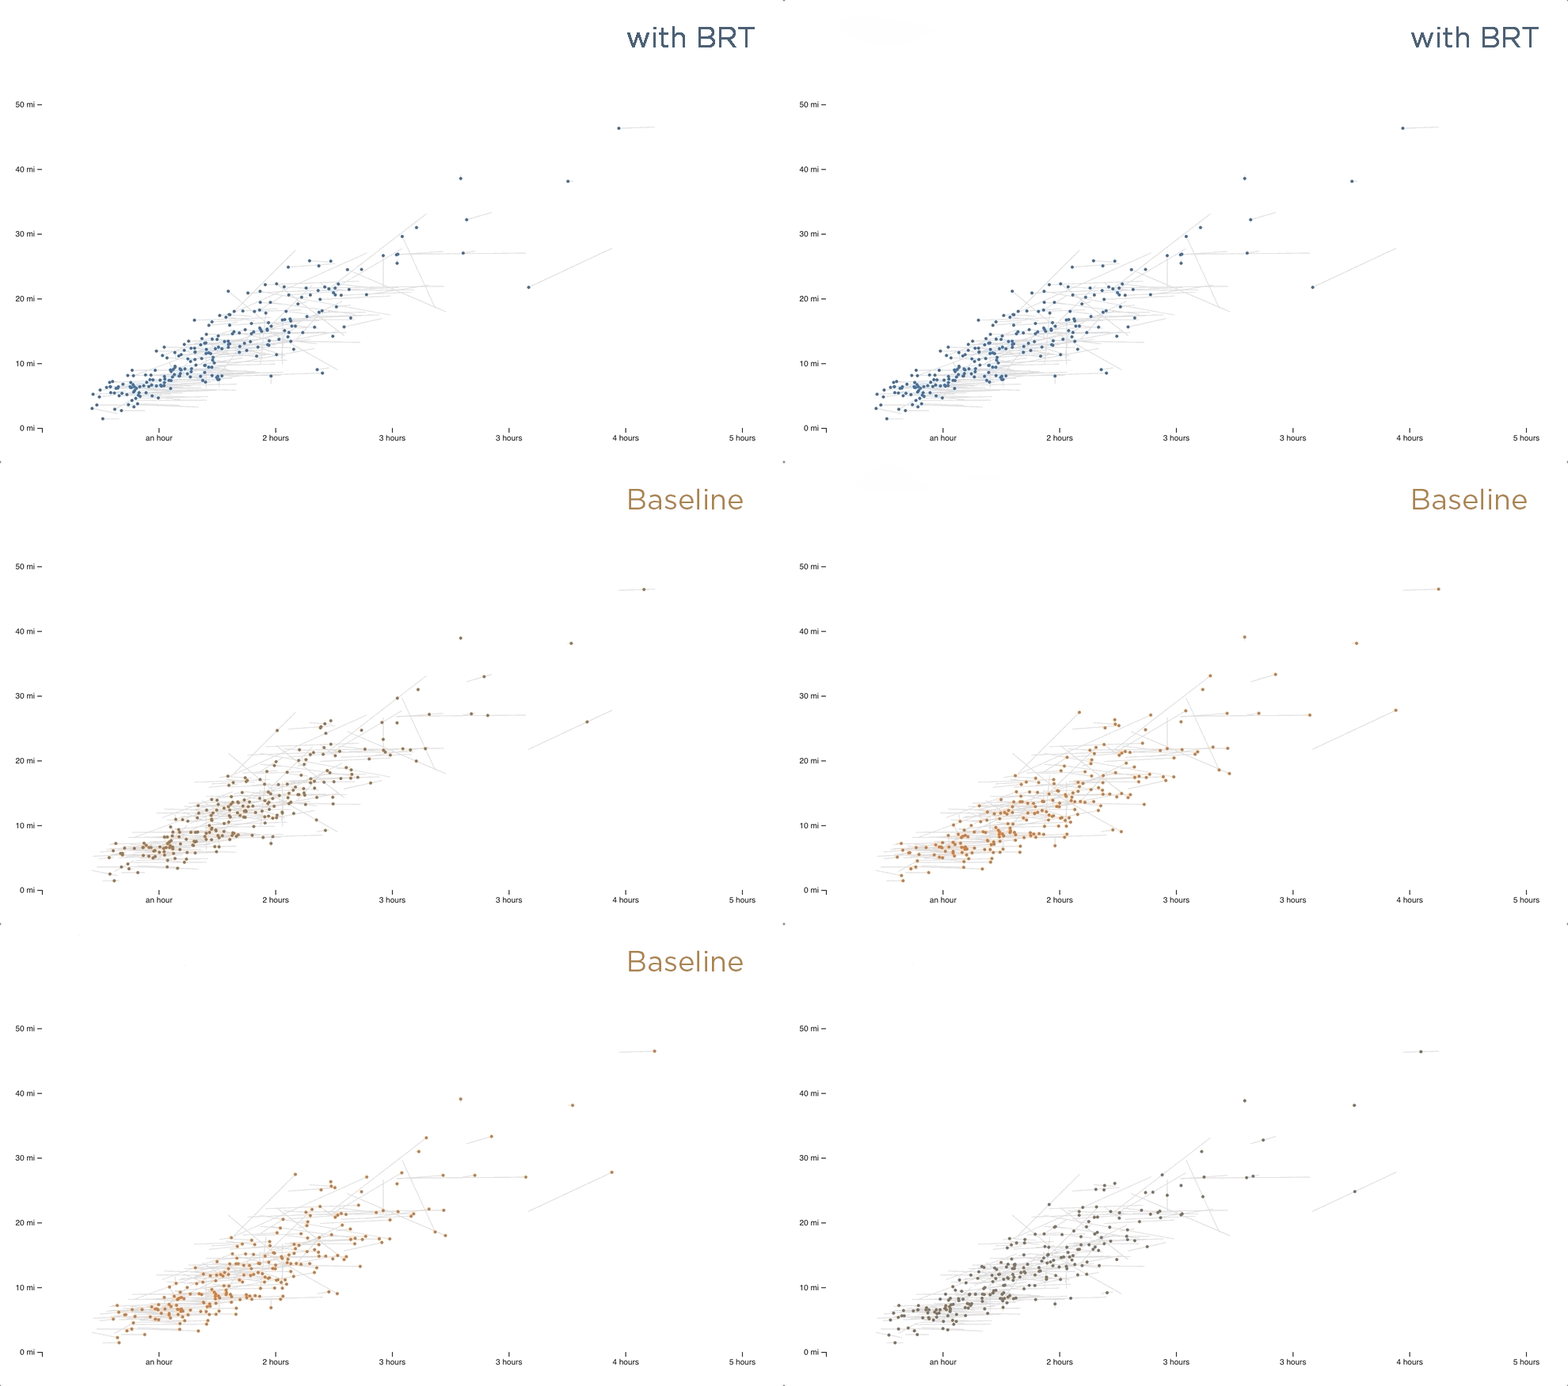
Kittelson and Omnimodal used interactive online data visualizations to show how travel time and travel distance changed between the baseline and alternative scenarios. They concluded that by adding Bus Rapid Transit (BRT) to the corridor, the median trip travel time would decrease by about 15 minutes.

Learn More at TRB 2019
Data models like this one will be critical for transit agencies as they continue to compete against driving and ride hailing. Jorge, Nathan and David will present their submission during TRB’s Annual Meeting and describe how these techniques can be scaled for larger projects in the future. If you’re attending TRB 2019, catch the presentation on Monday, January 14 from 3:45-5:30 PM in Room 150A at the Walter E. Washington Convention Center. A winner will be selected after all presentations are given.
In the meantime, you can read the data challenge entry here.
