March 31, 2022
Transit Planning and Community Engagement Lessons From Miami-Dade County
Miami-Dade County was facing a challenge known to many cities across the United States. Their bus system was losing efficiency and effectiveness, and thus losing ridership.
Many small changes over a series of decades meant that the bus system was reaching many parts of the county, but the system was becoming cumbersome to operate and bus riders’ commutes were only getting longer. Only five bus routes in the County were arriving every 15 minutes or less throughout the day, with most arriving every 30, 45, or 60 minutes. In addition, the network was not providing high frequency service equitably across the County, with its most frequent lines running primarily through Downtown Miami and segments of Miami Beach.
Miami-Dade County’s Department of Transportation and Public Works (DTPW) was on board to take a comprehensive look at the County’s bus routes. In 2020, they partnered with the Miami Transit Alliance, a local advocacy organization that had already begun meeting with communities to gather feedback, and began the work of examining and redesigning their system. Keep reading to learn more about the redesign, and how the DTPW communicated this significant project to the public in the months leading up to the public hearing.
In light of declining ridership, Miami-Dade County's Department of Transportation and Public Works (DTPW) decided to undertake a redesign of the County's bus routes.
A Comprehensive Bus System Revamp
Every transit system must find the balance between two important factors: frequency and coverage. The DTPW’s technical analysis looked at two broad scenarios: 1) a coverage scenario serving as much of the county as possible, and 2) a ridership scenario focused on providing high frequency competitive service on major corridors.
Over the course of the redesign, the team surveyed more than 5,000 people countywide, conducted 140 direct outreach efforts, and met with major stakeholders including elected officials, department leaders, community organizations, and bus operators. After learning about the two scenarios and their outcomes, 72% of people expressed a preference for bus stops being spaced at least every two blocks, or about ¼ mile apart. Hearing that residents generally preferred the tradeoff of removing some bus stops to improve speed of service, the DTPW advanced the ridership scenario as the preferred design following the approval of the County Commission
This scenario became known as the Better Bus Network, a plan to provide higher frequency routes in Miami-Dade County’s densest areas, opening up greater access to jobs and amenities through public transit. Higher frequency service with appropriate stop spacing offers two major benefits: firstly, riders can catch a bus on major corridors without having to wait more than 10 or 15 minutes; and secondly, buses stopping less frequently means they get from point A to point B faster. In addition, as speeds increase across the entire transit system, more service can be provided for the same cost.
The emphasis on frequency is complemented in the Better Bus Network by a high degree of equity across socioeconomic groups. The network was designed to improve service for the people that need it most, delivering equitable service that prioritizes seniors, people in poverty, minorities, and households with no vehicle. The Better Bus Network provides frequent transit near 28% of residents in poverty (compared to 12% in the existing network) and 23% of residents of color (compared to 9% in the existing network). On average, residents in Miami-Dade County can access 31% more jobs in 60 minutes by walking and transit through the Better Bus Network.
However, despite the general community support of the ridership scenario, the DTPW anticipated some opposition to removing bus stops. In the final months leading up to the public hearing to determine adoption of the plan, they sought to make a final community engagement push to make sure residents all over Miami-Dade County were fully informed of the proposed changes, and brought on Kittelson to lead this effort.
Giving Residents the Benefit of Detailed Information
The Better Bus Network was set to bring about significant changes. The old bus system had about 7,500 bus stops, while the planned system has just over 5,000 bus stops. The DTPW knew this may not be welcome news to residents whose closest bus stop was being taken out or moved, and wanted the information disseminated in a way that was as detailed as possible while being easy to access and absorb.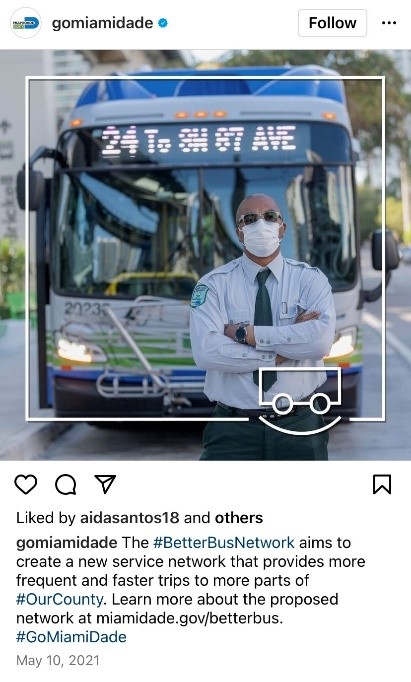
In addition to the more traditional components of our communications plan-community and stakeholder workshops, electronic surveys, a detailed project website, social media outreach, outreach at bus terminals, and the video shown above-the DTPW and Kittelson had to get creative in figuring out how to provide details at the bus stop level. In other words, we wanted residents to see exactly what changes were coming without asking them to flip through a 50-page report or sit through a technical presentation, or receive information that was too high-level to be helpful.
The solution was ESRI Story Maps, an online interactive mapping engagement tool. Our project team used this site to build a before/after slider comparing the old system with the new system. The site displays route and headway information for every bus stop in an easy-to-use interface. Every bus stop is georeferenced so that website users can zoom in and out on a map to see the proposed changes. You can view the interactive map here.
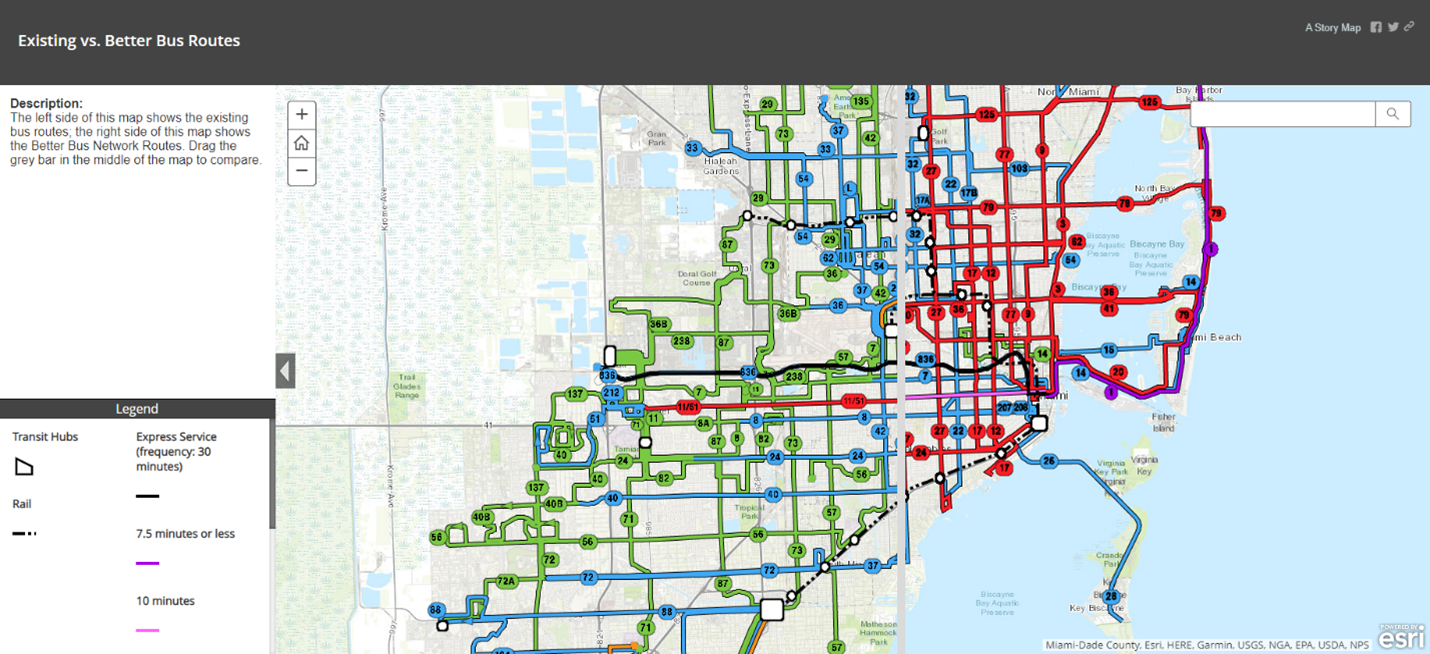
We used ESRI Story Maps to build a before/after slider comparing the old bus system with the proposed Better Bus Network.
The map was shared with residents through the project website, and the Miami Transit Alliance staffed a phone and text line to directly address questions as they came up.
Prioritizing ADA Compliance
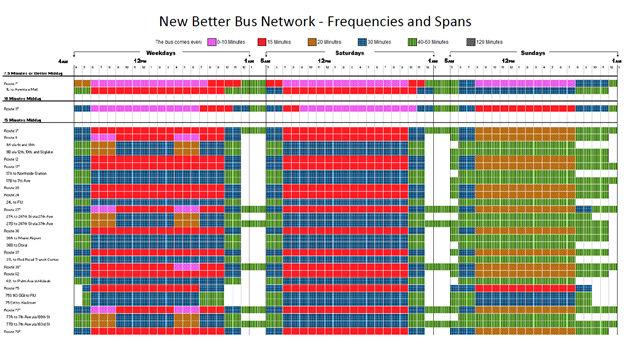
The DTPW wanted to make sure that all residents had access to information about the plans for the bus system. All of the colors used in the before/after slider are ADA compliant so people who are color blind can distinguish between lines. We also created graphical frequency tables that use textures in addition to colors, so those who are color blind can look at the legend and use different textures (checkers, diagonal lines, etc.) to find the frequency of every bus route in the county.
Outcomes and Takeaways
In October 2021, Miami-Dade County’s Department of Transportation and Public Works (DTPW) received unanimous approval to implement the Better Bus Network. Implementation is expected to begin later in 2022 or 2023.
There’s a lot we can learn from a project like this one, but here are a few specific takeaways that stood out to our project team:
- Detailed information doesn’t have to be watered down for public consumption. Think creatively about tools that allow residents to see the specific changes being proposed-in this case, every bus stop in the County-through interfaces that are easy to understand and navigate.
- Work backwards, figuring out what tools you’ll be using as early as possible. This will guide how you collect and organize data throughout.
- Sharing information must come with giving people many ways to be heard. The Better Bus Network text and call line was a way for residents to provide tailored feedback and ask questions. Virtual public workshops included a whiteboard feature so attendees could post notes in real time that the DTPW addressed one by one.
In general, the DTPW’s work is a great example of how to address the transit challenges that other communities are facing. Ridership is a challenge everywhere, as is operational funding. The DTPW was able to get community buy-in and put together a plan that will provide more efficient, equitable, and economic transit service across Miami-Dade County for years to come.