March 18, 2024
Consider the drive-through espresso stand: yet-to-be-discovered in some regions of the United States, it’s a way of life in the Pacific Northwest and Alaska, offering a caffeinated hail Mary to travelers in the midst of a road trip. But how do practitioners assess the trip impacts of this unique land use that blends elements of a sit-down café with those of a drive-through fast food restaurant?
In fact, before 2003, most transportation professionals would have approached the prospect of developing a drive-through espresso stand as a radical prospect; because while it was becoming clear that such stands positively impacted the people visiting them, it was not yet clear how the trips made by those visitors impacted the existing roadway network. Thus, a study in drive-through espresso stand trip generation was commissioned.
The study of trip generation seeks to translate human travel behavior into numbers. To accomplish this, trip generation revolves around data collection, with practitioners conducting surveys and counts of the number of trips made to a development to help us understand how that land use – whether a shopping center, gas station, or apartment complex – impacts the existing transportation network. This, in turn, helps us match future developments of that studied land use type to suitable locations.
Trip generation is far more than simply tallying how many drivers travel to and from a land use. We think it’s a practice that has a reflexive relationship with the way we live our every day lives, both influencing it and being influenced by it.

Trip generation is the practice of conducting surveys and counts of the number of trips made to a development to help us understand how that land use impacts the existing transportation network.
First Things First: How Are Trips Counted?
The trip generation data used when making development decisions is typically either empirical, site specific, or a mixture of both.

The Trip Generation Manual, published and routinely updated by the Institute of Transportation Engineers (ITE), offers an authoritative compendium of empirical trip generation data by time of day and, in some cases, day of the week. The 11th Edition of the manual, published in September 2021, breaks land use into 10 categories ranging from “Port and Terminal” to “Residential” to “Services” to “Office.” Each of the 10 categories host a broad range of unique land uses: for example, “Residential” documents trip data for over 20 different types of housing.
Developments have intricate land-use taxonomies based on their purpose, construction, and operation, but broadly speaking the trips they generate can be estimated relative to their physical size or other unique attributes. For example, commercial land use are often measured by the number of trips generated per thousand square feet. Residences, on the other hand, might be measured by the number of trips generated per apartment or single-family domicile.
The ITE also publishes the Trip Generation Handbook, which assists practitioners in interpreting and using the data provided in the manual. The handbook differentiates between four types of trips.
- A primary trip is a trip that motivates travel in the first place, with a destination that terminates the travel session. A trip from home to work, for instance, may serve as a primary trip.
- A pass-by trip is typically described as trip made during the course of a primary trip that does not require deviating from the primary trip route. A person traveling to work who pulls into a coffee shop located along the primary route is making a “pass-by” trip for coffee.
- An internal trip involves an additional trip that does not require roadway travel on the public street system. If a bagel shop is located in the same complex as the coffee shop, for example, the person stopping for coffee could then make an “internal trip” for a bagel without having to travel on the public street system between uses.
- A diverted trip is an additional trip made over the course of a primary trip that requires deviating from the primary trip route.
The manual and handbook offer these complementary classifications so that practitioners have the vocabulary to describe as many trips as possible, and to reflect the reality that not all trips are created equal: different types of developments will draw different crowds at different intervals and regularities, and some trips are likelier to occur only if another trip occurs first.

The Trip Generation Handbook differentiates between several types of trips, since some trips are likelier to occur only if another trip occurs first.
If not all trips are created equal, however, then the hierarchy of trips also changes depending on where they take place. Consider how different life in Anchorage, Alaska, is from life in Boston, Massachusetts: not only are you likely to travel via different modes in each place, but the types of trips you make – and those you don’t – likely changes as well. Some fast-food chains attract devoted followings in specific regions of the country: in those instances, relying on the generic trip data found in Land Use 934 of the Trip Generation Manual (“Fast Food Restaurant with Drive-Thru Window”) might underestimate how a new development of a regionally beloved franchise would impact a community. In other words, the trips we make are cultural and responsive to each unique environment, not a universal, static checklist of the errands we run.
Standard practice using ITE trip rates has difficulty capturing these regional variations and idiosyncrasies, however. More broadly, while ITE trip rates work well for single-use, auto-centric developments, they generally do not account for project characteristics such as the mix of land uses, density and design, neighborhood connectivity and walkability, infill versus suburban location, and the variety of transportation choices offered. For mixed-use development and/or denser urban communities, additional adjustments or other tools are needed.
How does a practitioner know if ITE trip rates suit their needs? It might not. Trip generation is always a data-driven process, but practitioner judgment plays a role as well: if the existing ITE data doesn’t seem to accurately reflect the site-specific reality of comparable use cases, you might need to collect site-specific data to truly understand the impact of your prospective development in context.
What About Special Land Use Cases?
Collecting site-specific counts and considering context can be especially helpful for those special cases where a prospective development doesn’t fall neatly into any of trip generation manual’s existing land use definitions. This is relevant for untested land uses that may be products of some technological, entrepreneurial, or legislative advancement.
Prior to 2003, this might have been the drive-through espresso stand. Today, it might be a solar farm, “ghost kitchen”, marijuana dispensary, or electric vehicle charging station. Even familiar land uses can shapeshift over time into spaces that defy their conventional data: the shopping mall, for instance, has reinvented itself in the wake of e-commerce, now complementing its retail offerings with a entertainment offerings like movie theaters and arcades. This follows a general trend of hybridization—that is, more projects are being developed or redeveloped as mixed-use spaces that don’t fit neatly into any one land use category.
In these innovative or exceptional use cases, practitioners prepare for the development by providing trip estimates based on the estimated usage of the facility. This raises the question, however, of what the most accurate measurement of usage is. Should the dispensary measure for trips during peak hour volumes, or is it more reasonable to expect that traffic will spike to the site on weekends? Is physical size of the solar farm the best measurement for trips generated, or will its enormous size create an outsized expectation – would it be better to measure trips by the number of employees?
Sometimes, this question of usage – of which data set is the most representative of how the development will impact its site – is relevant even to well-established land uses. The impact of schools on the surrounding roadway network, for instance, may not necessarily be directly proportional to the school’s physical building size. Instead, using the school’s student enrollment to estimate trips to and from the school site can be a better way to estimate the structure’s impact on roadways.
These special use cases raise an important wrinkle to the practice of trip generation: land use changes as the way we live evolves. What do the recent and ongoing trends in trip generation reveal about the way we live today? And how might the innovations of today and tomorrow impact the practice of trip generation?
How Are We Changing Trip Generation Practices?
We need data that reflects life post-COVID-19.
The COVID-19 pandemic abruptly and substantially changed the way we live, work, socialize, and travel. Many of these changes have persevered, attenuated or not, past the acute phase of the pandemic and into the new normal of everyday transportation.
Take, for instance, the way COVID-19 reinvented the work commute. Before the pandemic, only 20% of employees with jobs that could be done from home actually worked from home; in October 2020, at the height of the pandemic, this number jumped to 71 percent. By January 2022, after the acute phase of the pandemic had subsided, the number remained at 59 percent, still a substantial increase over pre-COVID numbers. The increase in telework has had a dramatic thinning effect on people driving in rush-hour traffic, accelerating car commutes for people who still had to make them. (The effect wasn’t universal, however: people who commute via bus saw their commute lengthen during COVID due to reduced transit service.)
A reduction in commute-based trips reshuffled when in the day people run the errands they may have formerly folded into their commute. Working in tandem with the march of technological progress, this has also changed which errands warrant a discrete trip at all. Banking used to require an in-person appearance at a physical branch; now many people do their banking entirely online. While many people still prefer to grocery shop in person, others streamline the errand by opting for grocery delivery. The trip generation data we have largely does not reflect this wider dispersal or travel activity throughout the day, prompting the next trend in data collection:
There is a desire to expand our conception of a “trip”…
One of the broader criticisms of ITE Trip Generation targets the way it’s historically focused on vehicle trips. Only more recently has the Manual moved to recognize and quantify trips traveled on other modes, like walking, biking, transit, heavy trucks, or other non-auto vehicles.

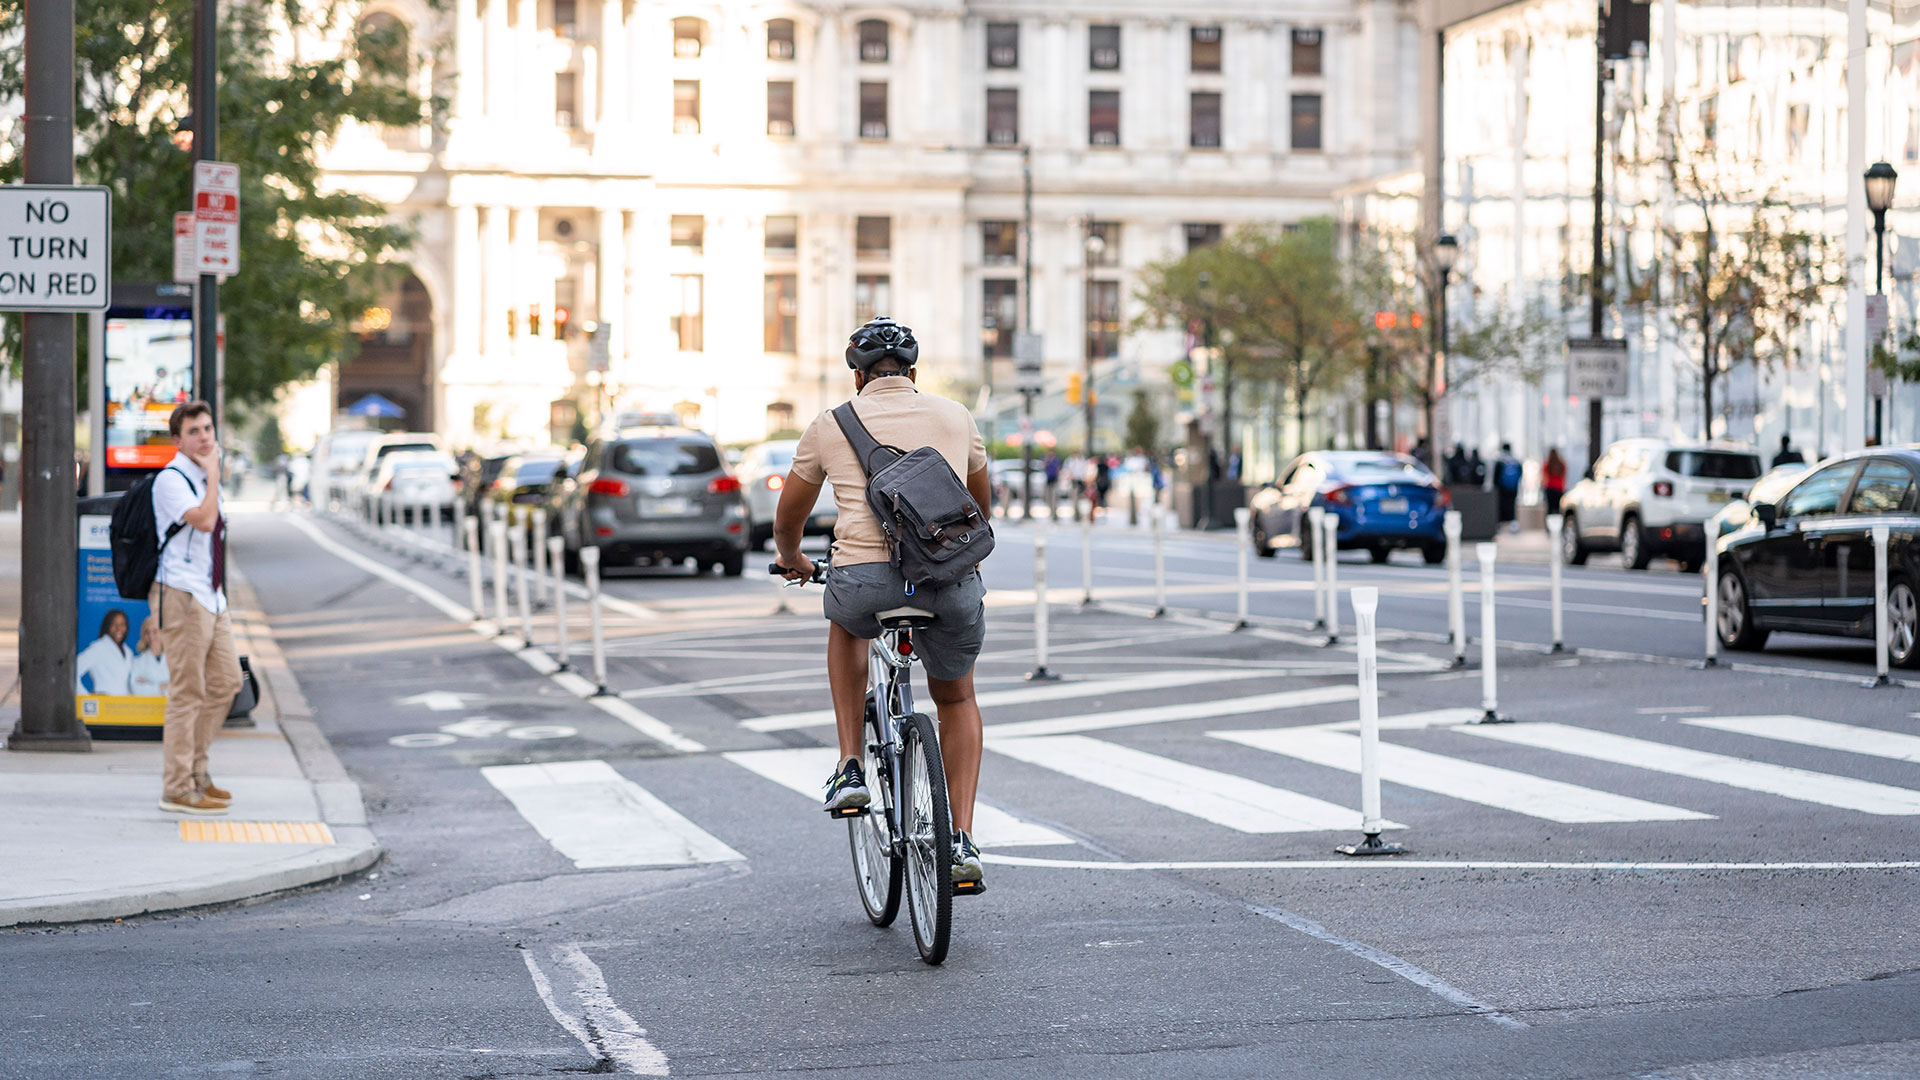
Obtaining accurate walking and biking counts will help us understand the benefits of these modes, and make them more viable by telling us where crucial active transportation infrastructure is missing.
Quantifying sustainable active transportation modes, like walking and biking, will be especially helpful to making those modes more viable in communities by telling us where crucial active transportation infrastructure is missing. The National Bicycle and Pedestrian Documentation Project states that “One of the greatest challenges facing the bicycle and pedestrian field is the lack of documentation on usage and demand. Without accurate and consistent demand and usage figures, it is difficult to measure the positive benefits of these modes.” The project has guided count initiatives for these modes, building on other efforts over the last decade to quantify active transportation trips, such as NCHRP Report 797: Guidebook on Pedestrian and Bicycle Volume Data Collection and its follow-up, NCHRP Web-Only Document 229. Continuing the efforts can further expand our understanding of how people conduct trips in various settings, from rural to urban, which can advance our understanding of how to develop those areas to accommodate those modalities.
…and for greater data specificity in our “destinations.”
Although our current trip generation categories exist to make fine distinctions between comparable land uses, these categories remain broad buckets that can’t always account for cultural context or special cases. As such, we’re interested in finding methods to be ever more exacting in our understanding of context-specific land use. Counterintuitively, achieving this greater granularity might require us to think bigger in terms of where we’re drawing data from.
Harnessing Big Data could provide an understanding of travel habits unprecedented in its specificity. By analyzing cellphone location patterns, for instance, a local transportation authority could easily tailor estimates to the hyper-localized proclivities of their area. In addition to helping us to understand the number and mode of trips taken, Big Data would also help us track the vehicle miles traveled (VMT) in a trip.
Another potential method of refining trip data involves coordinating with the businesses directly to better understand what databases they keep and to assess the local market conditions. Companies often have trip data-gathering practices of their own, though their numbers are proprietary and may be inaccessible to developers or transportation practitioners. Advocating for greater transparency with a corporation can benefit all parties involved.
Trip Generation Paves the Way for the Future—and Shows Us the Past
What these trends have in common is their tendency to expand our awareness of every type of travel that life inspires now and will inspire in the future. Trip generation plays a big role in making our world: it heavily influences project outcomes and infrastructure investments. It also influences development costs and how municipalities determine development impact fees.
Trip generation’s central role in developing our communities has bestowed upon it a funny side effect of incidental historian; placing all the editions of the Trip Generation Manual alongside each other forms a sort of timeline of gradual societal progress, marking the occasions when one land use entered obsolescence (so long, trips to Blockbuster) and another gained enough of a cultural foothold to warrant the creation of a new distinct entry (hello, trips to fast casual restaurants). The practice of trip generation isn’t just the work of preparing an existing transportation network for a new addition; it also records the societal changes it facilitates, commemorating all the worlds we have lived in while preparing us for the next one.
Here at Kittelson, we’re always looking for new ways to understand the intersections of human behavior and transportation. Feel free to reach out to Stephanie, Chris, or Fernando to discuss any of these ideas further!
