February 19, 2024
Stop us if you’ve heard this one before:
How do you deal with a fear of speed bumps?
You slowly get over it.
Turns out some dad jokes can be profound. In this case, it’s a reminder that making meaningful improvements in road safety in the U.S. means moving away from prioritizing speed. When short commute times remain the highest measure of engineering success, the safety of vulnerable road users (VRUs)—who are already at high risk of injury in the U.S.—will continue be threatened.
Our recent trip to the Transportation Research Board (TRB) Annual Meeting has given us a fresh perspective on this challenge. Originating from Australia and New Zealand, the following insights shed light on what tools better support increased roadway safety for VRUs—and more importantly, the priority tradeoffs they require.

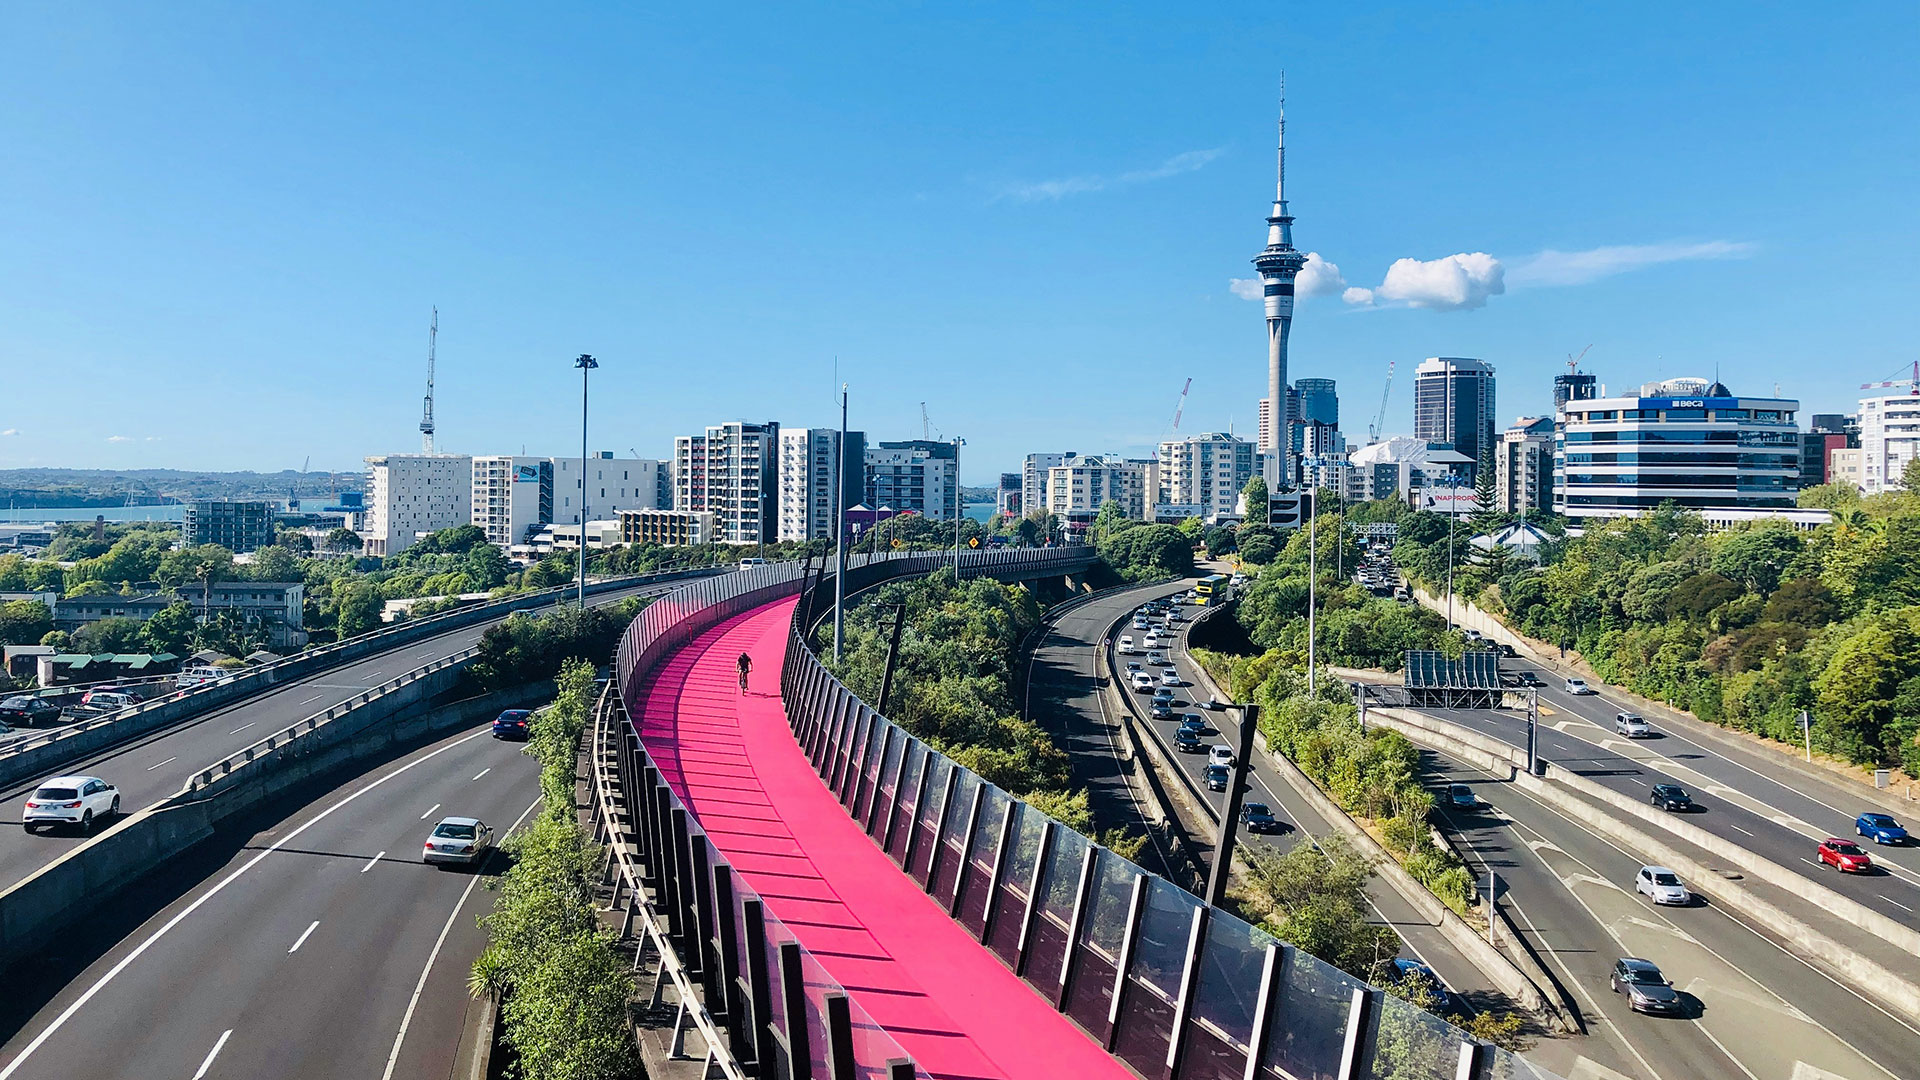
At the 2024 TRB Annual Meeting, speakers from Australia and New Zealand shared about remarkable safety strides these countries have taken over the last 50 years.
Safety Spotlighted at the 2024 TRB Annual Meeting
Road safety was a major topic at the 2024 Transportation Research Board Annual Meeting. In particular, the emphasis on VRU safety has been increasing over the last several years of TRB Annual Meetings in response to concerning national trends. Since 2010, transportation-related deaths of people walking in the United States have increased by more than 70%, and deaths of people bicycling on the road network are up more than 50%.
One of the first workshops at the Annual Meeting focused on pedestrian safety on urban arterials. Mixed land uses, higher motor vehicle speeds, and long distances between intersections contribute to significant safety challenges for people crossing such streets, which are often called “stroads” because their design elements sit somewhere between a typical street and a higher volume road. As a result, they don’t work well for anyone and our work in multiple states shows that suburban arterials create great safety concerns for people walking and bicycling.
3 Tools Contributing to Road Safety in Australia and New Zealand
In the face of VRU safety challenges that can feel overwhelming, it’s encouraging to hear examples from other parts of the world that have achieved meaningful change. Two such countries are Australia and New Zealand. Since their peaks in the 1970s, these countries have cut roadway fatalities by more than 60%.
Since their peaks in the 1970s, Australia and New Zealand have cut roadway fatalities by more than 60%.
During the above-mentioned TRB safety workshop, Bernard Carlon of Transport for New South Wales, Jessica Rattray of Waka Kotahi New Zealand Transport Agency, and Ping Sim of Auckland Transport highlighted three tools that have contributed to this radical progress:
1. The Movement & Place framework. This framework establishes the primary functions of each road based on its land use context and designs the road to fit. Target levels of service and comfort are set for each mode. For example, on small downtown main streets with mixed land uses, walking and bicycling are prioritized and level of service for motor vehicles is less important. Streets are designed accordingly, with narrower widths and very low target speeds to reduce crash frequency and severity. This approach has not been broadly adopted in the U.S., though some guidance documents, like the Florida DOT Context Classification Guide and the AASHTO Green Book, are moving the industry in that direction.
2. A holistic approach to speed management. Due to the kinetic energy imparted by vehicles moving at higher speeds, speed management is the most effective way to reduce the numbers of fatalities involving people walking and bicycling. Australia and New Zealand have found great success in the use of speed cameras, which are slowly gaining ground in the United States as some state legislatures have authorized their use. Roads are also designed with a target speed designated with an emphasis on safety.
3. Fully integrated Road Safety Audits. In Road Safety Audits, independent teams of road safety experts visit project sites to perform reviews of designs to ensure they are meeting safety goals. Integrating Road Safety Audits into all steps of the transportation project development process is a way to enhance their value to support a broader movement to ensure safety is part of the job of every person in an organization, not just those who have “safety” as part of their job titles.
These countries aren’t using tools vastly different from ours in the U.S. In fact, when we look at this list of tools, we see that everything they are doing is available to (or already being used on) the American transportation system. So how are they seeing such powerful results?
The key is mindset and priorities. Australia and New Zealand have an “all of the above” focus, doing everything it takes to move the needle on safety. Driven by media outcry, a political will to change, and a collective embracing of safety as a common goal, these two countries are proof that it takes a culture change to get the results we want to see.

The safety measures these countries are taking are available to (or already being used on) the American transportation system. What stands out are Australia and New Zealand’s priorities and mindset, as well as their “all of the above” focus, doing everything it takes to move the needle on safety.
“The crisis of pedestrian fatalities on U.S. roads cannot be solved in isolation,” states an FHWA report on lessons learned from Australia and New Zealand, based on a week-long study tour that FHWA and state DOTs conducted in these countries. “It is a result of decades of emphasis on motor vehicle mobility and access, at the expense of all other modes. Solving the pedestrian safety challenge requires a shift in our approach to transportation – from crafting high-level government policy and laws, through planning for the future of our built environment, to developing and implementing designs for roads and streets.”
The report goes on to share several overarching takeaways from its study of these two countries: human wellbeing at the center of transportation policy goals; the role of land use in contextualizing transportation priorities; and the need to be proactive, interdisciplinary, and holistic, including designing a transportation system that recognizes people make mistakes.
Truly Making Safety a Priority
Every transportation planning and design decision is about tradeoffs. This reality is emphasized in NCHRP Research Report 1036, Roadway Cross-Section Reallocation: A Guide. The NCHRP 1036 framework walks practitioners through evaluating tradeoffs and making decisions, navigating the competing priorities of safety, access, mobility, efficiency, economy, environment, health, and equity… to name a few!
As much as we’d like to prioritize everything, we need to make thoughtful decisions on our area of focus, so we should always be asking ourselves: what are we prioritizing, and why? If safety is truly the highest measure of success, are we willing to accept slower speeds as a tradeoff for improving dangerous conditions? These questions are built into the NCHRP 1036 framework, which emphasizes the importance of context and community priorities when deciding which tradeoffs are acceptable and which are not.
Overcoming deeply entrenched industry norms requires a cultural shift to choose safety over speed. But like the dad joke about speed bumps reminds us, we can get over it. We’re eager to build on the positive momentum generated by Australia and New Zealand’s success stories, FHWA’s initiative to document it, and the framework laid out by NCHRP Research Report 1036 to encourage the evaluation and articulation of priorities in design decisions. Let’s “bump” safety to the top of the list.
