December 13, 2023
Too Much of a Good Thing?
If you’re part of an agency that seeks to improve traffic flow in its jurisdiction, the good news is that you’re well covered. Several traffic signal solutions exist, from pre-timed control, fully actuated control, actuated-coordinated control, adaptive traffic signal control, and traffic responsive control. More recently, automated traffic signal performance measures (ATSPMs) have also become a popular solution for the way they empower agencies to be more proactive in their management of traffic signal operations.
What’s the bad news? Ironically, it’s the same as the good: the sheer number of solutions and the particularities of each means that actually knowing which one will best address your problems can be difficult.
Thus far, existing tools have explored whether “adaptive” signal technology—that is, signal timing technology that adjusts the rhythm of signal changes depending on traffic conditions such as volume of traffic and level of congestion—could serve as a silver-bullet solution for every use case. In reality, however, many other practical considerations, such as agency staffing, budget, maintenance practices, and the presence or absence of critical signal infrastructure, can render the good-on-paper solution of adaptive technology impractical or outright unfeasible for meeting an agency’s needs.
Traffic engineers need a process that can evaluate multiple traffic solutions holistically and in a way that takes into account the practical reality of their department. To address these challenges, we conducted a deep dive into the principles that inform tool development; then we put these principles to work, developing a comprehensive tool for the Pennsylvania Department of Transportation (PennDOT). The developed tool can assist agencies in the process of selecting an appropriate traffic signal system solution for a range of corridor characteristics, operational objectives, agency capabilities, and constraints.

Practical considerations, such as agency staffing, budget, maintenance practices, and the presence or absence of critical signal infrastructure, can render the good-on-paper solution of adaptive technology impractical or outright unfeasible for meeting an agency’s needs.
A Principled Tool Is a Useful Tool
Agencies have to make decisions around what tools they’ll use all the time. We studied how agencies select and apply tools to projects to get a better understanding of what an agency finds desirable in a tool. We then combined this understanding with our own thoughts on
1) Hit the data sweet spot: Any tool in development should be robust enough to collect its key factors without overwhelming a user with data or becoming too unwieldy to use.
2) Organize around ease of use: Required input data for the tool should be readily available for most agencies to allow for its broad application.
3) Don’t make a “black box”: The tool should be able to help a user understand why it selected a given solution.
How It Works: Architecture of Traffic Signal Systems Solutions Toolbox (Ts3T)
To help agencies understand which traffic signal solution would most improve network operations under given conditions, we designed the Traffic Signal Systems Solutions Toolbox (Ts3T). The toolbox was designed as a stand-alone MS Excel tool consisting of several worksheets, as illustrated below.
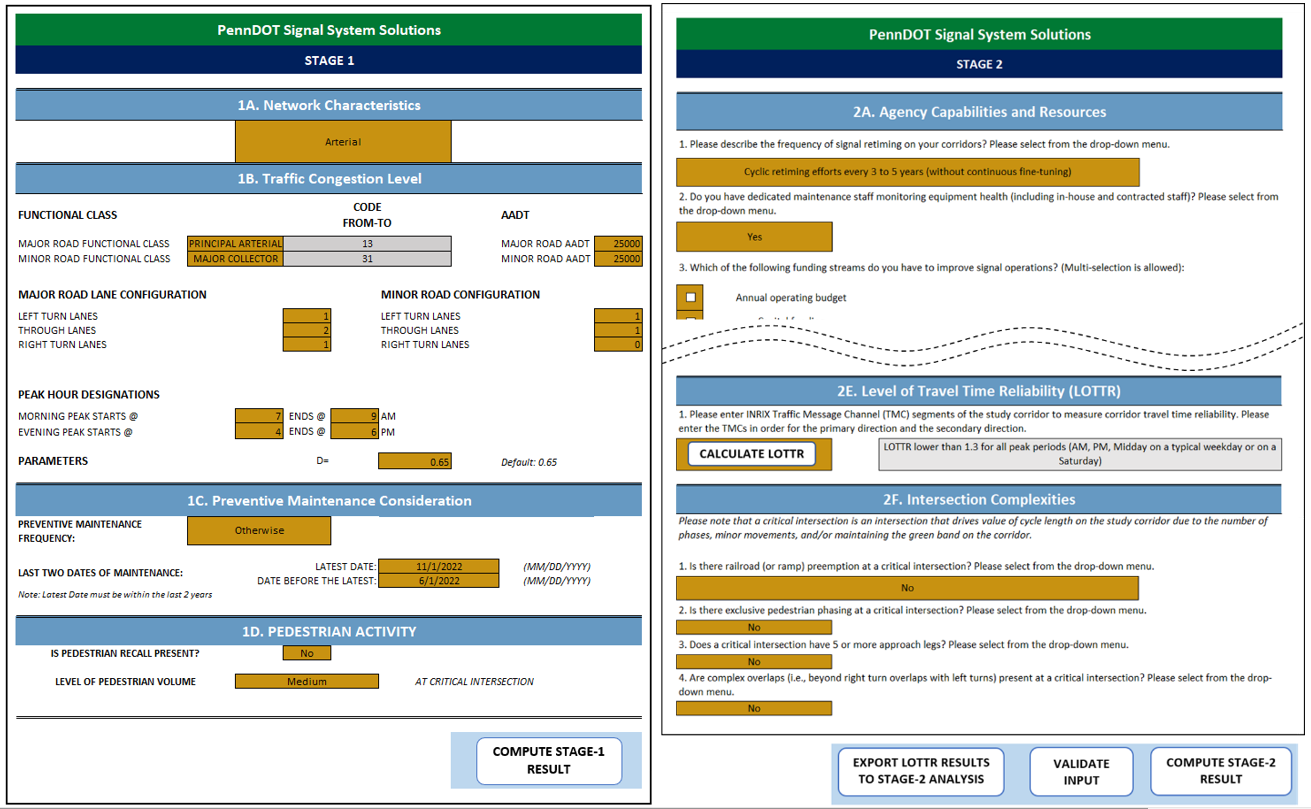
Excerpt from the Traffic Signal Systems Solution Toolbox Interface, Stage I (left) and Stage II (right)
This toolbox works as a two-stage process. In the first stage, the tool conducts high-level screening of various signal systems solutions based on basic informational elements related to signal systems that are readily available to the agency.
In Stage I, users of the tool are asked to enter information that helps the tool tailor a solution to the given conditions. The information required relates to the following categories:
- Network characteristics: What is the composition of the corridors in question? Are they one-way or two-way grids, arterials, or isolated intersections?
- Traffic congestion level: How bad is congestion throughout the subject corridor? The tool calculates this on its backend based on provided inputs like AADT, functional roadway classification, number of lanes at the critical intersection, and the directional distribution.
- Maintenance considerations: What triggers maintenance? Does maintenance only occur during concern calls, or does it regularly occur annually or at some other frequency?
- Pedestrian activity: Is there low, medium, or high pedestrian activity along the corridor in question?
In some cases, the information fed to the toolbox at this stage may quickly funnel the user to one clear solution. For instance, if you applied the tool to find a traffic signal solution for an arterial road with low pedestrian activity, appropriate maintenance, and volume-to-capacity ratio of below 0.6 at the critical intersection (meaning the roadway operates below capacity), then the toolbox would not suggest overhauling the signal solution. It would instead recommend conducting minor drills with the existing signal infrastructure (like reviewing any applicable ATSPM reports or timing plans to ensure current green time is optimized) because there is ample capacity. Good news! In this case, you’re all done; there’s no need to move on to Stage II.
However, if the user reaches the end of Stage I with multiple potential solutions still in play, then the toolbox takes the user to the second stage for a more detailed assessment.
Within Stage II, a user is asked to provide more details regarding the analyzed network within the following categories:
- Agency capabilities: What capacity does the user agency have? Here, the tool asks questions designed to elicit an unbiased account of staff resources for signal operations, maintenance, and funding streams
- Operational objective: What does the agency hope to achieve with the corridor’s traffic flow?
- Diversions: Are there recurring or non-recurring diversions of freeway traffic onto the corridor?
- Special event generators: Are there regular or irregular events, such as sports games or concerts, that would substantially impact the traffic flow of the corridor?
- Level of travel time reliability (LOTTR): (estimated through connections with the RITIS API interface)
- Intersection complexities: (e.g., presence of railroad preemption, exclusive pedestrian phases, complex geometry that requires additional phases)
A special module for the estimation of the level of travel time reliability (LOTTR) is automatically initiated within the analysis during the second stage. Figure 2 shows the relationship between the LOTTR estimation module and the developed toolbox.
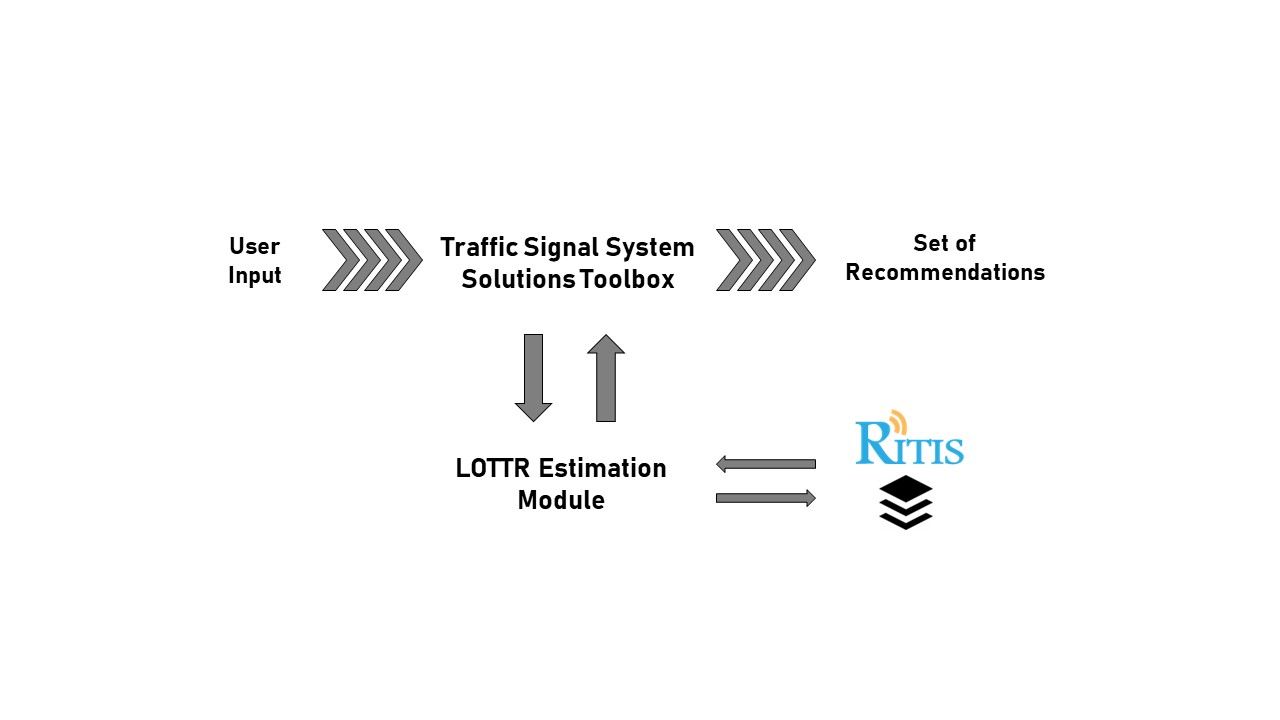
Traffic Signal Systems Solutions Toolbox Components
By providing answers to each of these categories, embedded logic in the tool’s backend investigates feasible solutions with impressive flexibility. It can, for instance, source a solution that takes into account the size and regularity of a concert event and its impact on traffic. The diagram below gives a peek into a matrix that powers the tool’s decision-making.
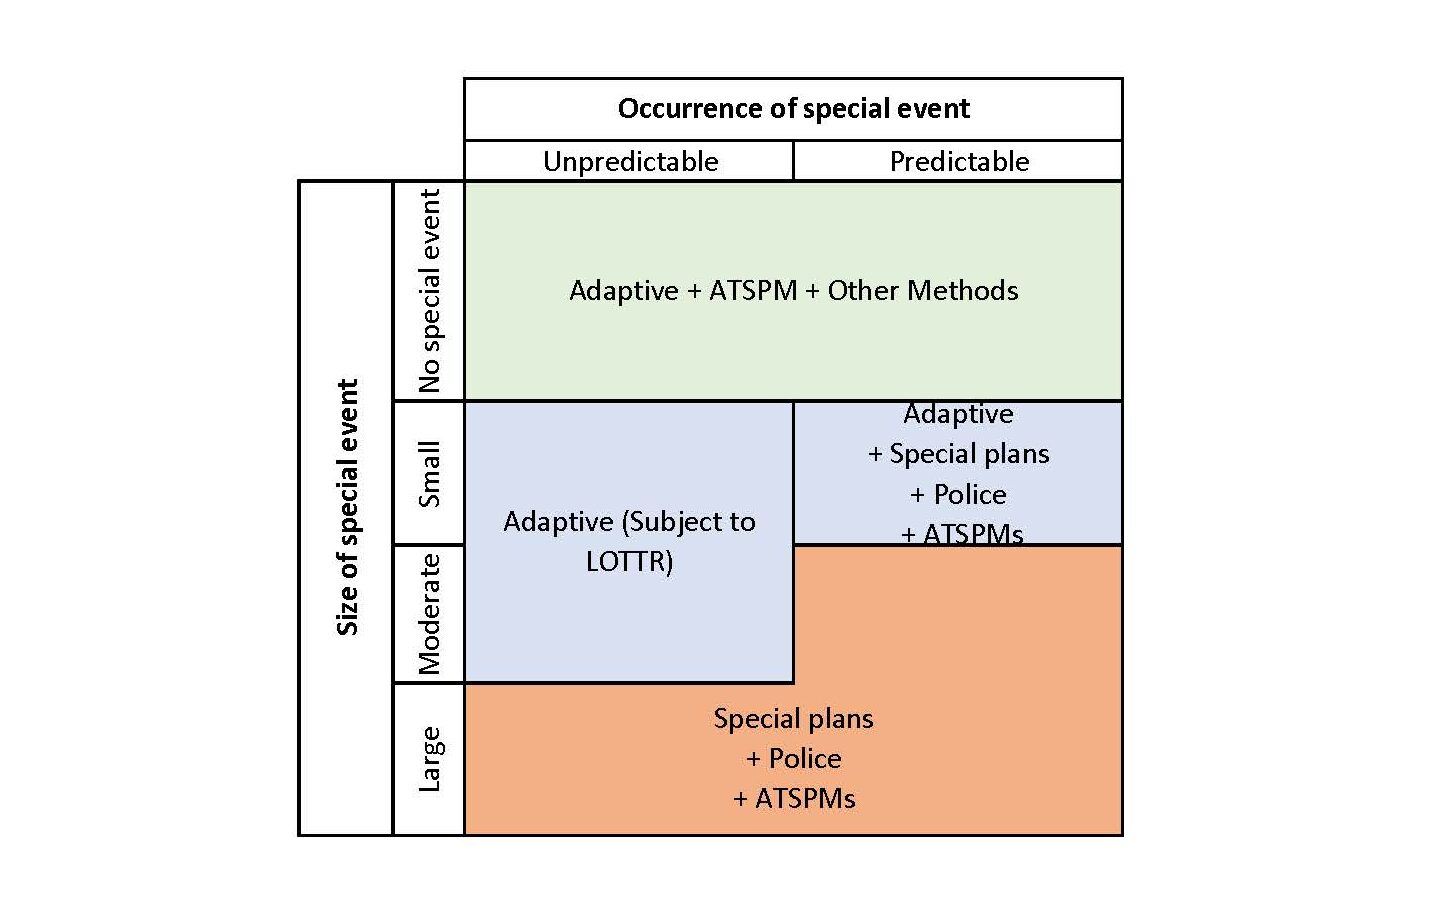
Relationship between Size and Occurrence of Special Event and Potential Signal Systems Strategies
The Tool in Action
We applied the tool to several case studies and sites across the Commonwealth of Pennsylvania (shown below) to ensure that the tool offers reasonable solutions under varying conditions.
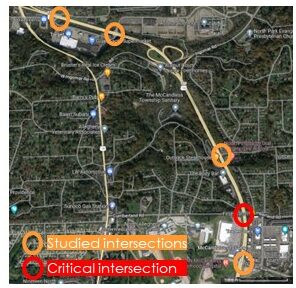
In the first case study, on McKnight Road, the toolbox provided an “early-exit” from Stage I and suggested better utilization of existing infrastructure, as the corridor should have ample capacity based on the entered traffic volume and number of lanes. To optimize the existing infrastructure in a way that would better regulate traffic flow throughout the corridor and at the site’s critical intersection, practitioners could:
- Revisit timing plans for more efficient green allocation
- If coordinated, check controller clock and drift
- Review ATSPMs, if available
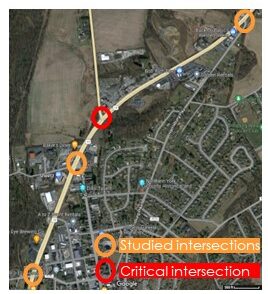
Results from the second case study, conducted along U.S. 15 with the primary objective of prioritizing mainline conditions, indicated that while most factors favored the deployment of adaptive traffic signals, no travel time reliability issues were noted on the corridor (which is used as a proxy to demand fluctuations in this study).
Because adaptive signals are typically an effective solution under demand fluctuations, the toolbox recommended other solutions, including:
- If applicable, use ATSPMs for signal retimings, such as reallocation of split times and offset adjustments, to better serve mainline movements
- Cyclic signal retiming (every 3-5 years)
- Consider increasing cycle length while managing queues
- Consider using lead-lag to increase mainline progression bandwidth (ensure to avoid “yellow trap”)
- Use floating force-off if the corridor is coordinated-actuated
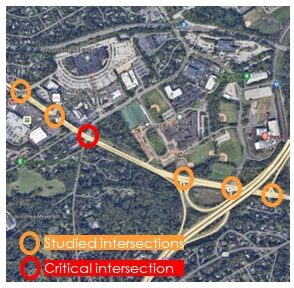
Lastly, results from the third case study along U.S. 30 showed that the toolbox recommended adaptive traffic signals on this corridor based on its characteristics.
These case studies produced the results we’d hoped for based on the understanding of the local staff. Throughout the studies, the toolbox demonstrated a sensitivity to agency capabilities; a flexibility in the recommendations it offered; and an ability to cohere its recommendations to local knowledge, agency expectations, and unique corridor conditions.
While the toolbox made good on the principles that guided its creation, we still believe its main strength is its ease of use for practitioners. The application of the toolbox to numerous case studies showed that it takes less than a few hours to apply the toolbox for a given study corridor. This ease of use, to us, is the whole point: the convenience of the toolbox allows agency practitioners to facilite efficient workflow and optimal utilization of resources.
Want to Learn More?
At Kittelson, we’re committed to finding the right solution for every problem. Reach out to Nemanja or Burak to discuss any of these ideas further, or join us at the upcoming TRB Annual Meeting! We’ll be presenting at Poster Session 2232 on Monday, January 8 from 6:00 PM – 7:30 PM at poster #B663. Learn more about this poster and our other TRB sessions by perusing Kittelson’s TRB schedule here.
