January 17, 2024
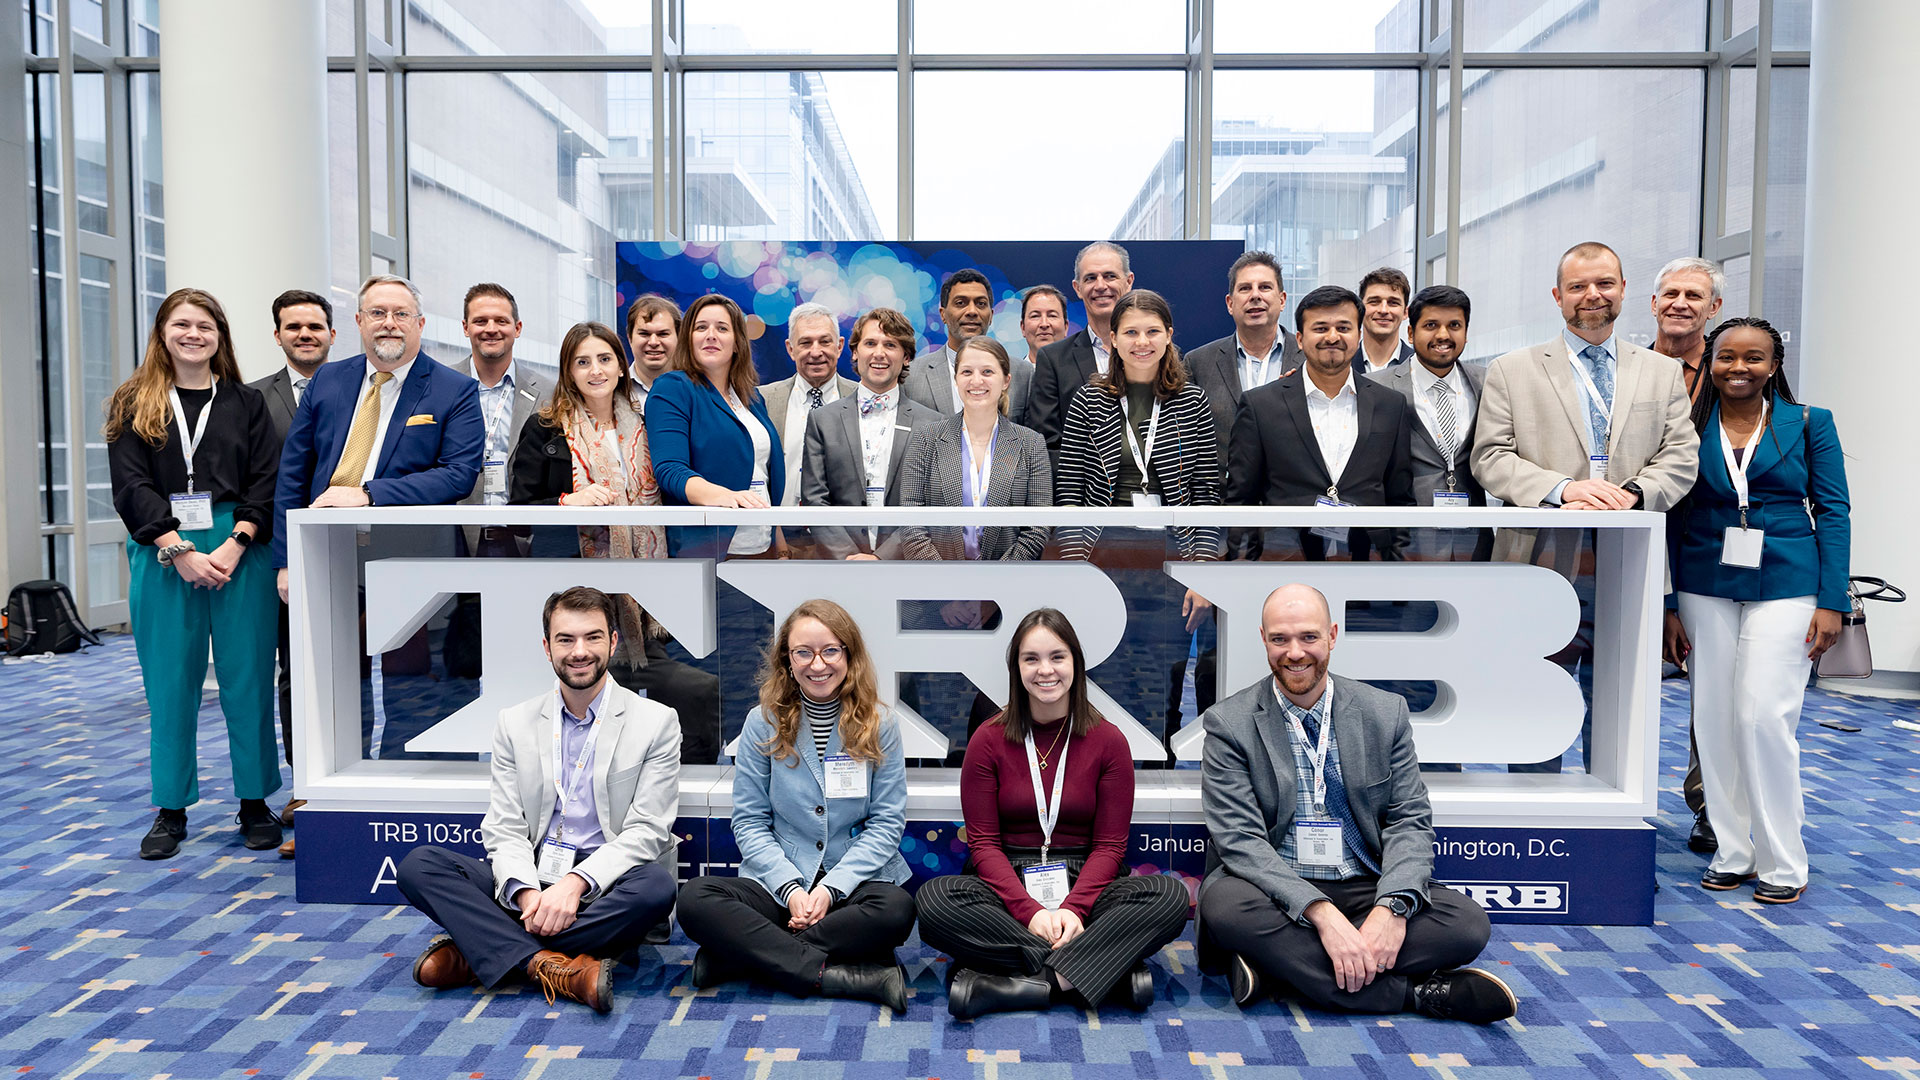
We just returned from the 103rd Annual meeting of the Transportation Research Board (TRB), and our heads are buzzing with ideas, information, and insights. Kittelson sends a large cohort to TRB every year for many reasons—including the opportunities to connect with fellow researchers and present the research we spend so much time on every year—but perhaps most importantly, because the Annual Meeting is a window into the future of our transportation systems. It’s fascinating to be on the leading edge of identifying the needs in guidance and practice that will drive future research, and it’s a way we strive to give back to our profession.
TRB 2024 was no exception. While many important topics came up in one form or another, from our perspective, four themes were prominent across the sessions we attended between January 7 and 11.

The TRB Annual Meeting is a window into the future of our transportation systems.
#1: Safe streets for all users is possible, but requires overcoming deeply entrenched industry norms.
The 2024 Annual Meeting highlighted two sides of the spectrum with regard to vulnerable road user safety. On one side is the dire situation our country finds itself in. Since 2010, deaths of people walking in the United States have increased by more than 70% and deaths of people bicycling are up more than 50%—all the while, roadway fatalities in most other countries across the globe have been declining. At all levels, we’re starting to see acknowledgement that this is a circumstance that isn’t going to change without massive action.
On the other hand, however, there are examples of radically achieving road safety. It’s possible. But it will require a fundamental shifting of priorities and everyone to be on deck.
At Workshop 1001, “Pedestrian Safety on Urban Arterials,” a representative from New South Wales, Australia shared how Australia and New Zealand have cut their roadway fatalities by more than 60% since their peaks in the 1970s. How have they done it? By recognizing roadway deaths as a national crises and diligently applying safe systems principles and tools to reduce speeds and design infrastructure that is forgiving to human mistakes. All of the tools these countries have used are available to use on the American transportation system. But they have a culture and will to change that is not yet widespread here in the US. This session highlighted the reality that it will take a culture change to get the results we want to see. Every one of us in this industry, not just people with safety in their job title, is a part of the solution. Read more from FHWA’s report on learning from Australia and New Zealand.
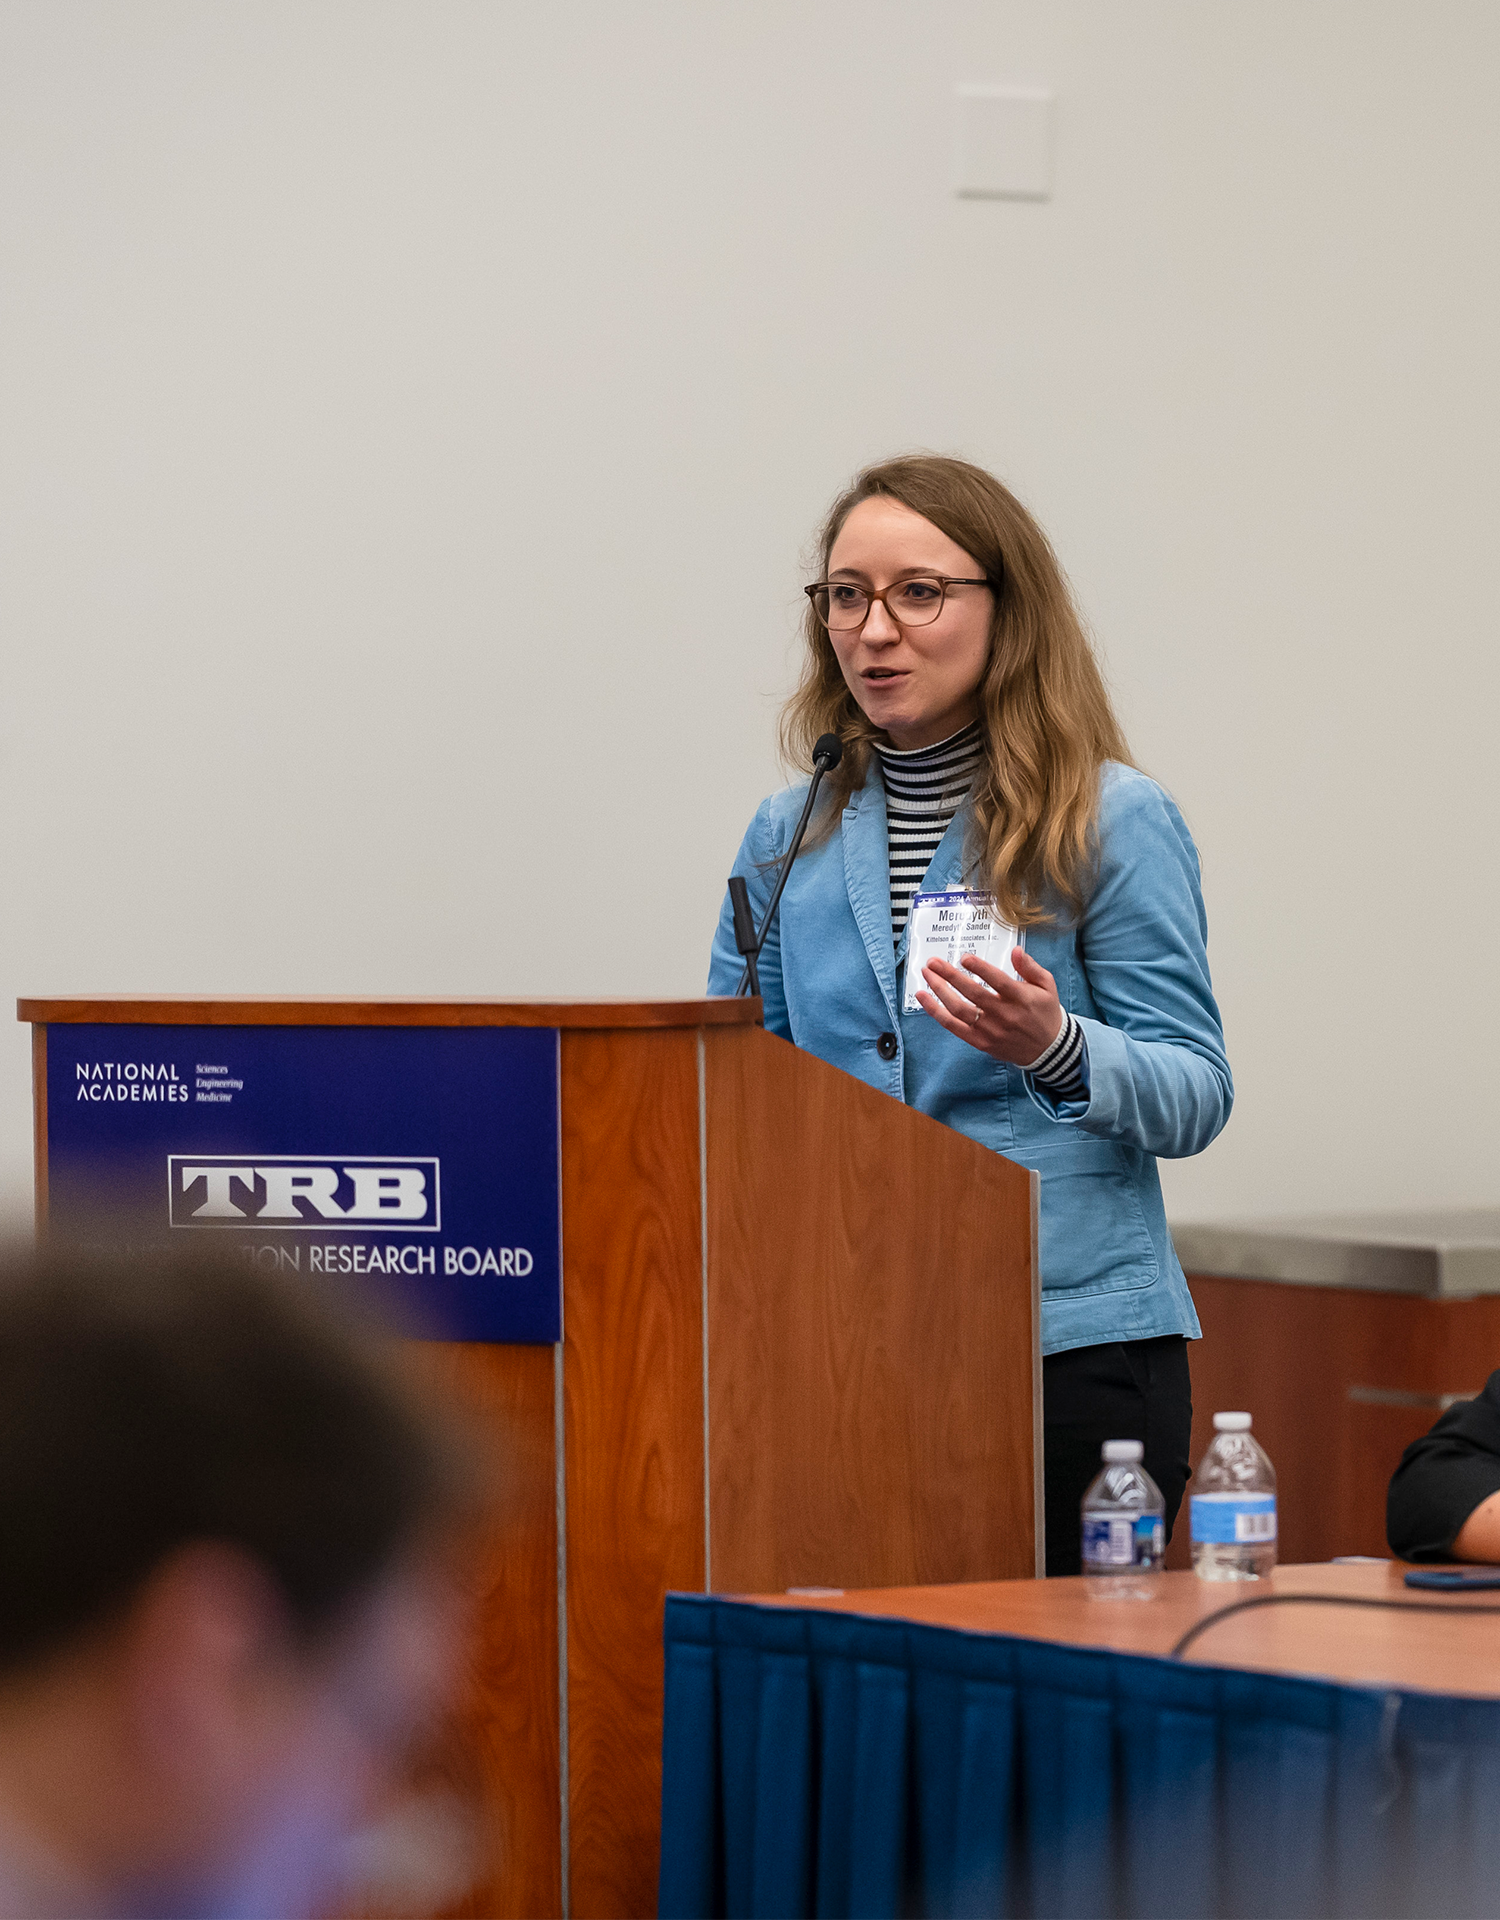 At Lectern Session 2123, Meredyth Sanders and Conor Semler spoke on NCHRP Research Report 1036, Roadway Cross-Section Reallocation: A Guide, which puts the spotlight on decision-making, tradeoffs, and priorities. While safety is cited as an important consideration in every transportation project, other priorities (such as efficiency) often win out, whether consciously or unconsciously. Acknowledging that every design decision comes down to tradeoffs, NCHRP 1036 provides a framework for assessing those tradeoffs and ultimately, articulating the priorities behind design decisions. Using this framework, engineers and decision-makers will be forced to confront and articulate their priorities, with the goal of completing a project being able to explain why one benefit was chosen over another.
What would it look like if safety was truly the highest measure of success? Meredyth and Conor provided the example of Hoboken, New Jersey, a town outside New York City that celebrated seven years of no traffic deaths at the end of 2023. Hoboken has employed a toolbox of safety measures, such as lower speed limits, protected bike lanes, improved crosswalks, and curb extensions. None of these measures were new, but there was a powerful underlying theme: safety as the true priority.
Ultimately, discarding the safest solution because it “won’t work” operationally is no longer acceptable. The same session featured a talk by Bastian Schroeder on using a new 24-hour framework for operational performance measures that strives to move practitioners beyond the “peak 15 minutes of the 30th highest hour of the day” that is so deeply engrained in our profession through national resources like the Highway Capacity Manual and Green Book.
Additionally, in a lectern session on “Safely Designing and Operating Intersections for All Pedestrian Abilities,” Pete Jenior introduced the upcoming Intersection Control Evaluation Guide (NCHRP 17-98) to a packed house. The Guide, due for publication in early 2024, will incorporate safety as a key performance measure in evaluating which type of traffic control to employ at an intersection. The new ICE framework moves away from the traditional ranking of intersections based on vehicular volume-to-capacity (v/c) ratios (as operationally, there is little difference between a number of 0.71 vs. 0.65 or 0.59). Instead, the new framework ranks intersection alternatives based on their safety performance, and merely checks whether the v/c is in an adequate range for the context of the intersection.
Our profession still has a long road ahead of us, but the examples of Australia, New Zealand, and Hoboken show us what’s possible, and those sparks of hope fueled invigorating and motivating discussions across the Annual Meeting about how we can rewrite our country’s transportation safety story.
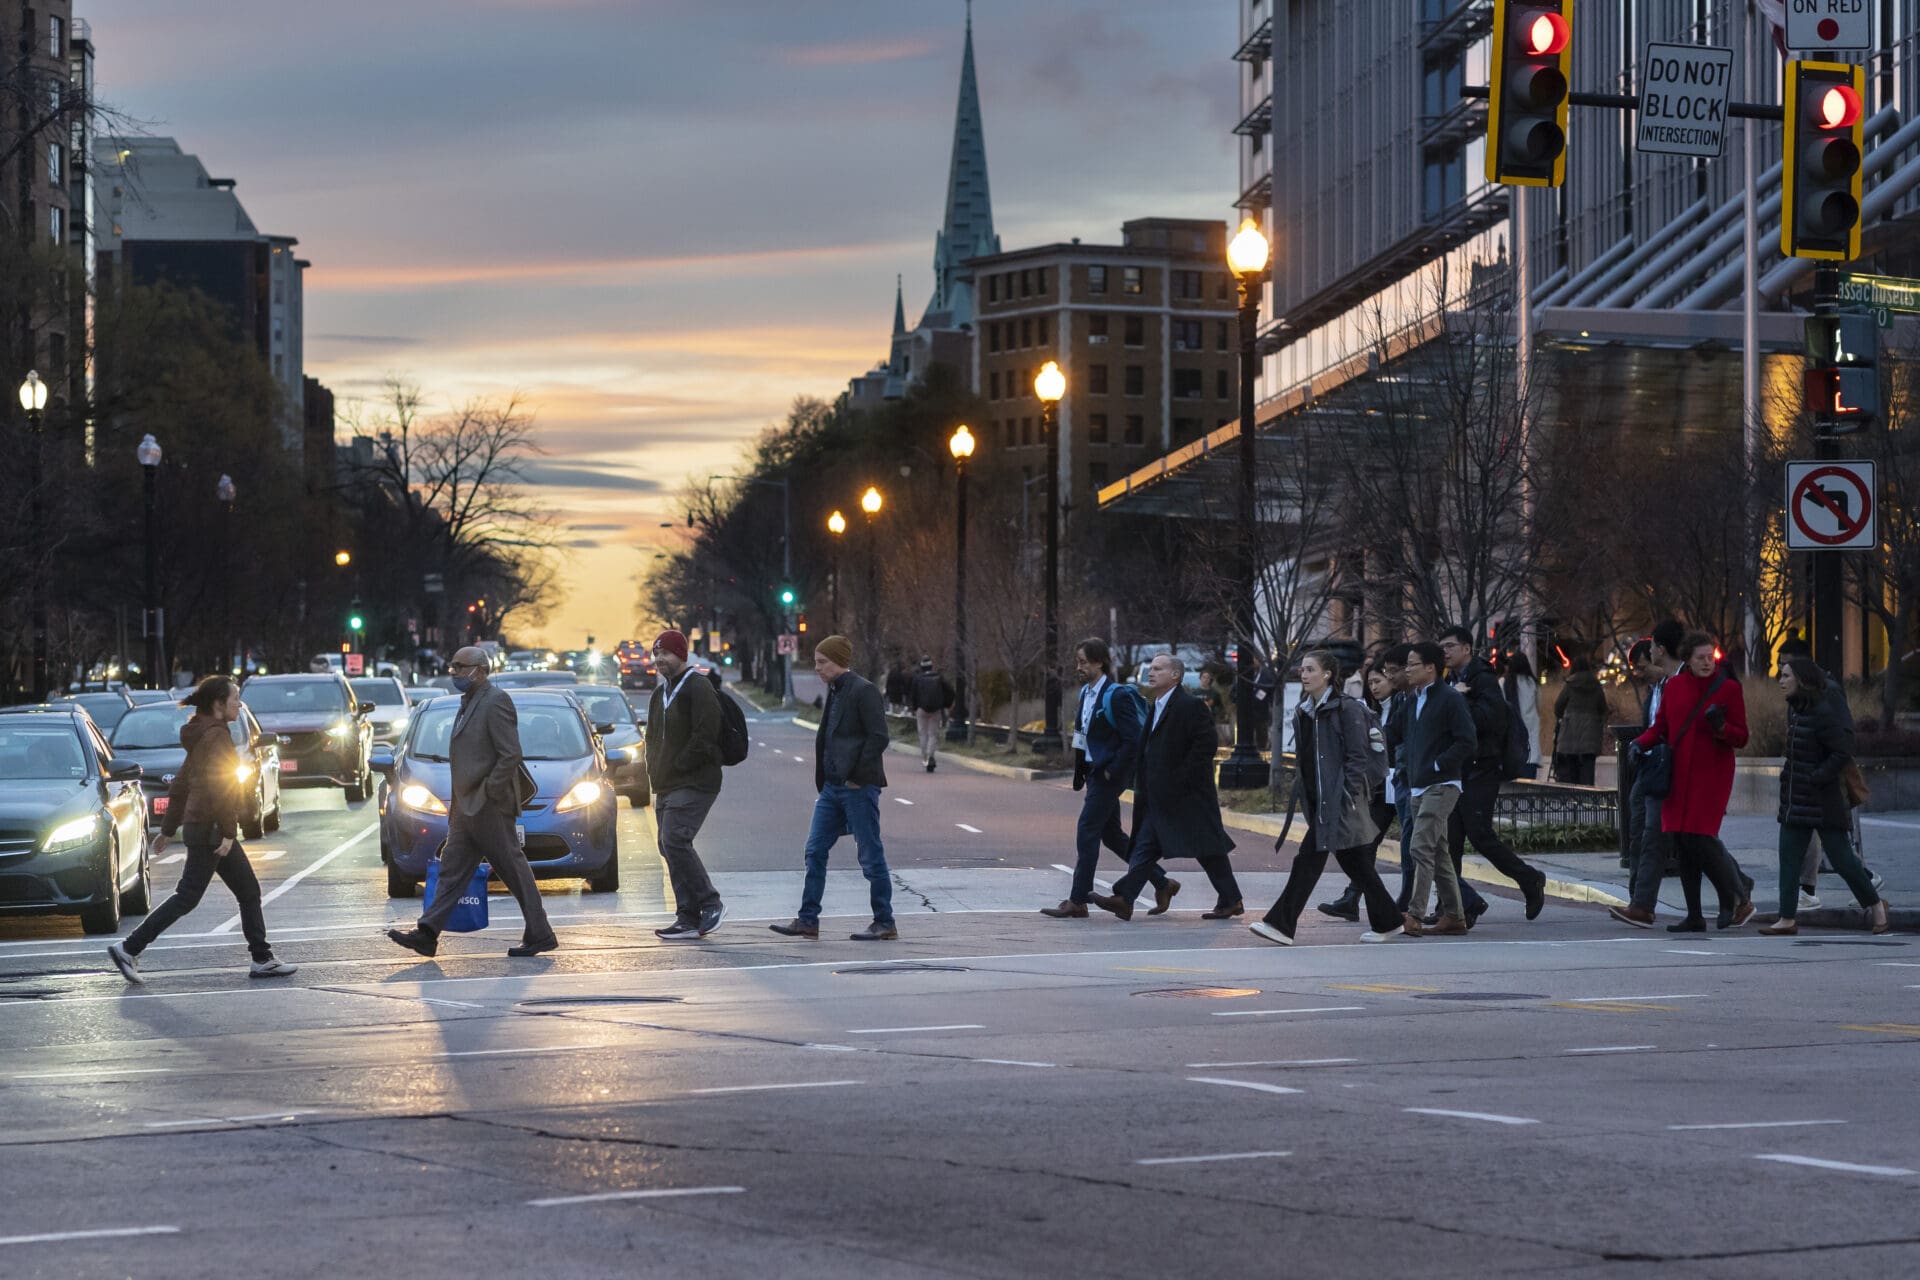
Every design decision comes down to tradeoffs, and NCHRP 1036 provides a framework for assessing those tradeoffs and ultimately, articulating the priorities behind design decisions.
#2: AI is a tool in the toolbox.
The amount of research centered around artificial intelligence (AI) at TRB 2024 was truly impressive, from the automation of signal timing to real-time crash forecasting. One glance at the Annual Meeting program is enough to show you the explosion in the number of research papers on AI and machine learning topics. (Shout-out to our friends at the Standing Committee on Artificial Intelligence and Advanced Computing Applications, AED50, for reviewing what must be an all-time record number of papers assigned to a single committee!)
With an evolving topic like AI, it’s easy to get caught up in either the excitement or fear (or both). We need to remember that our profession has been adapting to new technologies for decades. Artificial intelligence is a tool in the toolbox. The question at hand, which is certainly not limited to the field of transportation, is understanding the situations where AI and machine learning can improve efficiency and accuracy (with human oversight), and when human judgment shouldn’t be substituted. At the Annual Meeting, we heard many examples of where automation is strategically saving time through reducing the need for human review.
A poster in the “Safe and Smart Transportation Systems Powered by Artificial Intelligence” session described the use of a Natural Language Processing (NLP) algorithm, trained by a ChatGPT plugin, to analyze critical phrases used by law enforcement officers’ crash narratives. The model analyzed a five-year period of crash records from the Ohio Department of Public Safety and achieved a classification accuracy of 84-92%, showing promise for using automated systems to support safety efforts and reduce the need for manual reviews.
A study from the Pennsylvania Department of Transportation, presented at a poster session on “Safety Impact on Road Users Including Pedestrians, Bicyclists, and Others,” set out to learn if video analytics can predict conflicts as reliably as human review to be able to select and evaluate countermeasures. Collecting accurate pedestrian and bicycle volumes is difficult, and relying exclusively on crash data means waiting for crashes to happen before taking preventative action. The findings from the intersections they studied indicate that critical events identified by video-based event monitoring technology do in fact reveal recurring issues between vulnerable road users and vehicles that engineers can use to proactively identify safety issues.
Zooming out to the big picture, it was interesting to hear how state DOT leaders are thinking about how AI fits into their organization and processes. Public agencies need to be able to provide explanations—when things go right, when things go wrong, when money is spent—and AI is often not easily explainable. This reinforces the need for humans to remain in the decision-making seat, and ensure AI tools are working for them to answer questions and complete specific tasks. Being able to define and explain the application of an AI tool also mitigates the fear of AI being a “black box” that can’t be trusted.
AI also offers interesting possibilities from a workforce perspective, as staffing at DOTs can be challenging. While AI can never take over the role of human judgment needed at all levels of the organization, these tools can enable staff to spend their time effectively; for example, completing an initial screening of roadways so people can apply their expertise and decision-making on the locations that need attention.

At the Annual Meeting, we heard many examples of where automation is strategically saving time through reducing the need for human review.
#3: Equity should be measured.
Equity has been a major topic at recent TRB Annual Meetings, which is heartening in of itself, but especially exciting to see it talked about in more quantitative terms at the 2024 Annual Meeting, with a strong emphasis on defining, measuring, and tracking the benefits and burdens of transportation decisions on the people they impact.
At the Equity in Transportation Committee meeting, members of the U.S. Department of Transportation talked about steps being taken to assign performance measures to equity so that it can be more formally and consistently measured and tracked over time. For example, the Bureau of Transportation Statistics maintains Intersections Transportation Data + Equity Hub 1.0, a resource that provides tools, metrics, and data to analyze transportation access and the impacts of the transportation system on communities. In December 2023, TRB released Elevating Equity in Transportation Decision Making: Recommendations for Federal Competitive Grant Programs. USDOT also shared about upcoming guidance that will help state DOTs and communities quantify, monitor, and evaluate progress towards their equity goals. There is lots to look forward to in transportation equity research!
Of course, while measuring equity is vital for consistency and accountability, equity can never be boiled down to just numbers. It will always be about people, and it will always be our job to dig beneath the surface and identify the story behind the data so we can put the right project in the right place. In the “Integrating Equity into Transportation Safety Management” workshop, members of the Minnesota Department of Transportation told an insightful story about project identification. After mapping equity regions around one town and overlaying crash data on top of it, they noticed a hot spot on an arterial. Rather than jumping straight to solutions, they decided to dig deeper. They found there was an old factory and people were walking 8-9 miles down a three-lane, high speed arterial to get to the factory to go to work—with no sidewalk! It was clear the solution needed was safe pedestrian passage. This is an example of how data provides useful information, but it’s our job to ask “Why?” and dig to understand the full story.
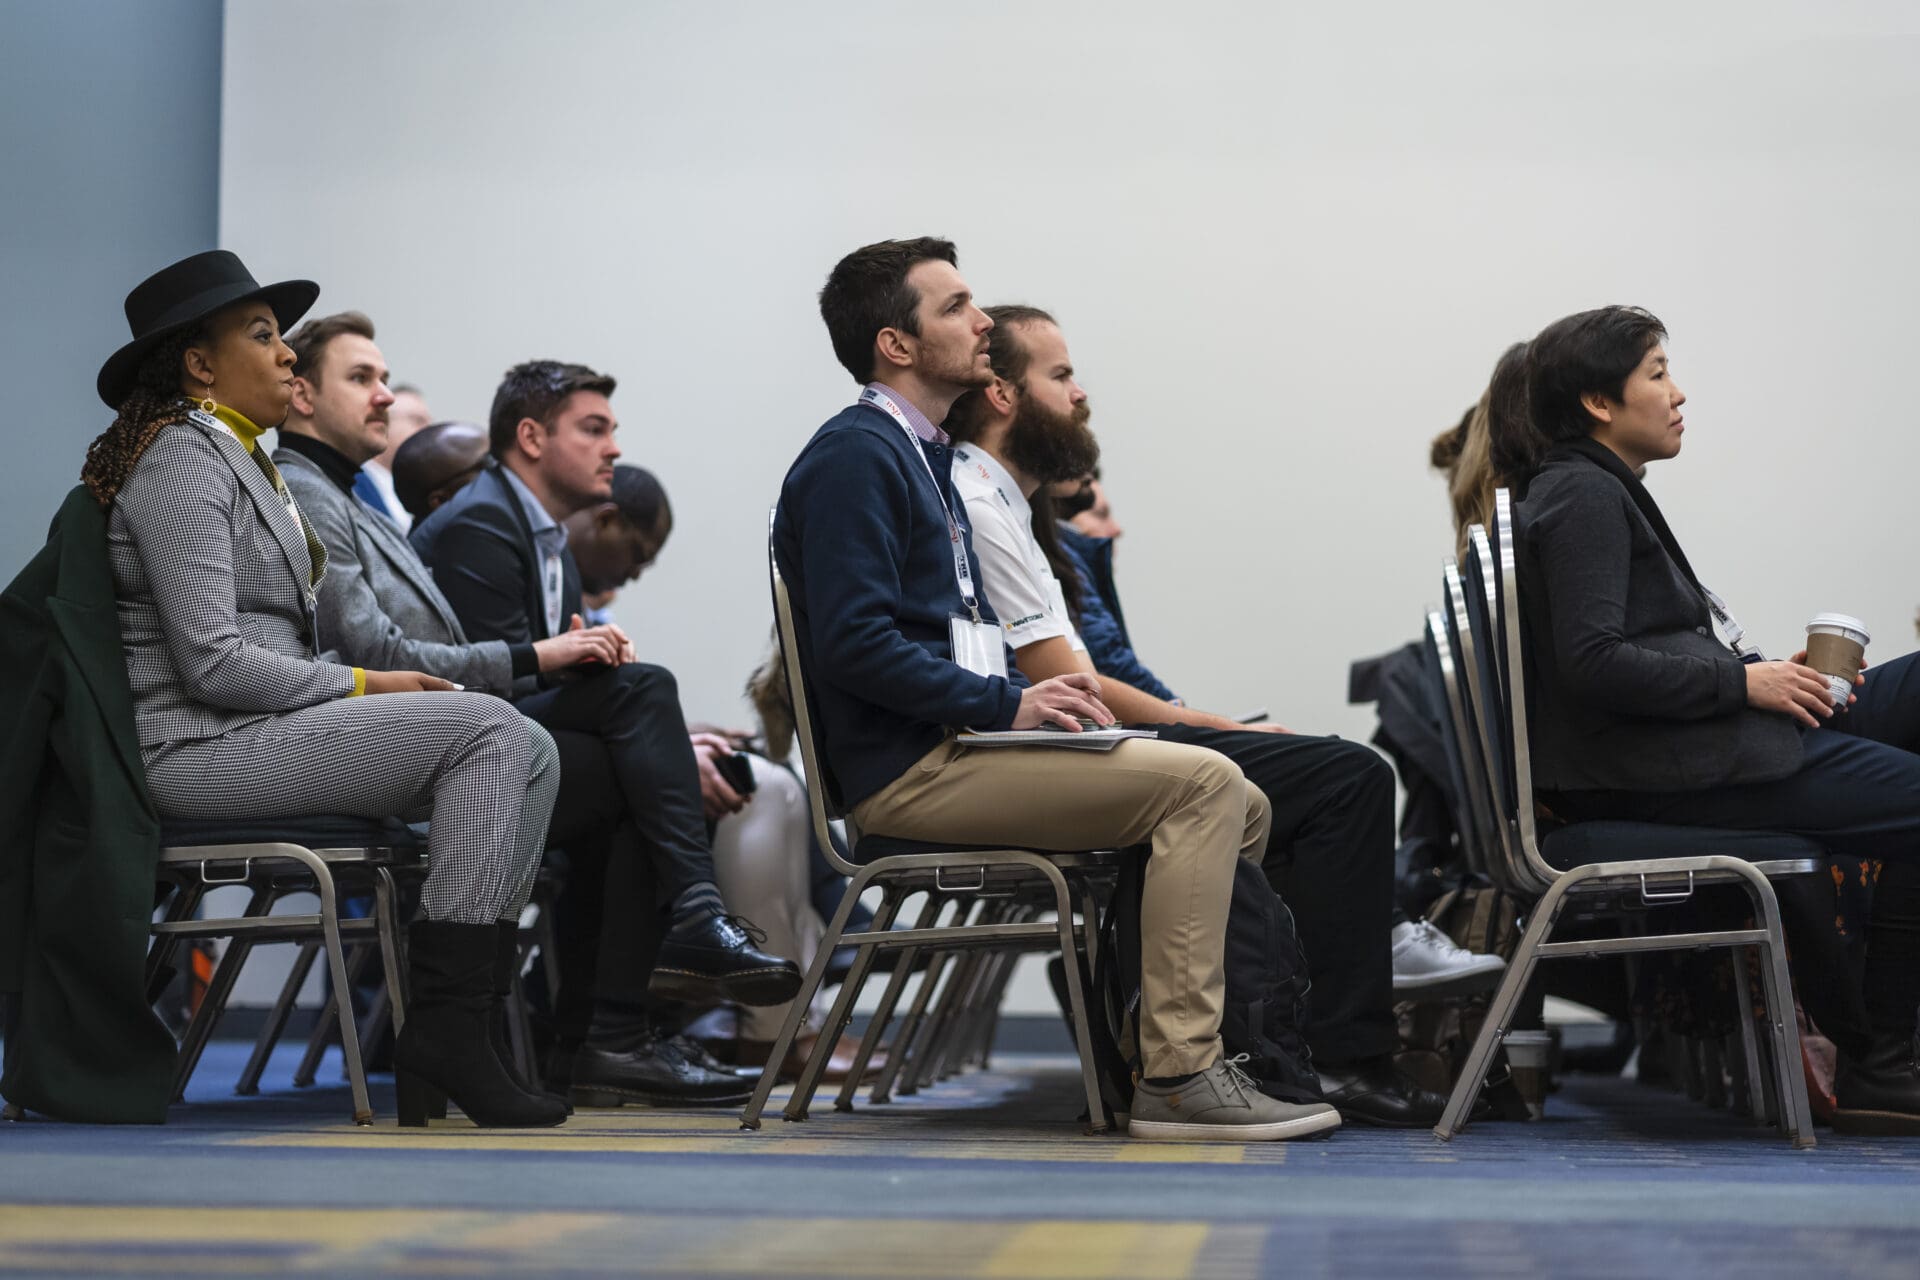
It was exciting to see equity talked about in more quantitative terms at the 2024 Annual Meeting, with a strong emphasis on defining, measuring, and tracking the benefits and burdens of transportation decisions on the people they impact.
#4: Data is most useful when it’s standardized, fused, and shared.
Sessions across TRB highlighted the usability of data: how it can be standardized and shared to manage and improve system operations.
Data was a big topic in discussions on pedestrian and bicyclist topics, with a whole workshop (“Bicycle and Pedestrian Data Fusion: Learning from Each Other”) dedicated to the idea. As noted above, collecting accurate bicycle and pedestrian counts is difficult; yet, collecting counts is foundational for tracking active transportation activity. There was lively debate over whether bad data was worse than no data, as well as if you should always release a volume estimation model.
The topic of data fusion was also front and center at the Standing Committee on Highway Capacity and Quality of Service, where an invited speaker provided the latest thoughts on data fusion of sensor data and probe-based travel time data, as well as trajectories. As more and more agencies are recognizing the value of (singular) big data sources and integrating them into their day-to-day practice, only few are embracing the opportunities created by fusing multiple sources and achieving 1+1=3 outcomes. So rather than comparing results from two or more sources, data fusion opens new realms of real-time prediction and diagnosis—especially if powered by AI-based computations and algorithms.
Data also needs to reflect the needs of all users! In Lectern Session 2123, two speakers shared their expertise and insights regarding level of traffic stress metrics for pedestrians and bicyclists for network analysis. They emphasized the need for new and better geospatial data sources to support these analysis methods, including being able to look at intersection and crossing-level stress in addition to the more established segment-level measures.
Sessions across TRB highlighted how data can be standardized and shared to manage and improve system operations.
What Did You Learn at TRB 2024?
We think these prominent and powerful themes are indicators of where our profession is heading next. We also acknowledge that with more than 1,000 sessions taking place in the span of five days, there are many more ideas and findings to talk about from the 2024 Annual Meeting!
Of note, in early January, TRB unveiled the latest Critical Issues report, which is published every five years. “Critical Issues in Transportation for 2024 and Beyond” covers the themes highlighted in this article as well as many other important topics, including climate change, public health, and the economy, at the forefront of research minds heading into this year.
What topics stood out to you from the 2024 Annual Meeting? Let us know on LinkedIn!

